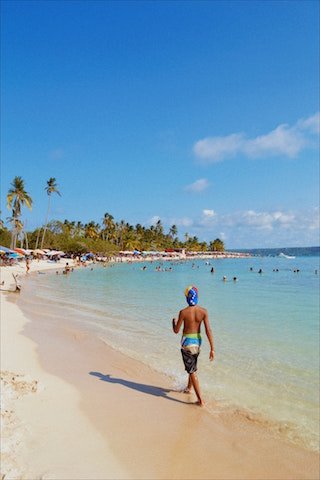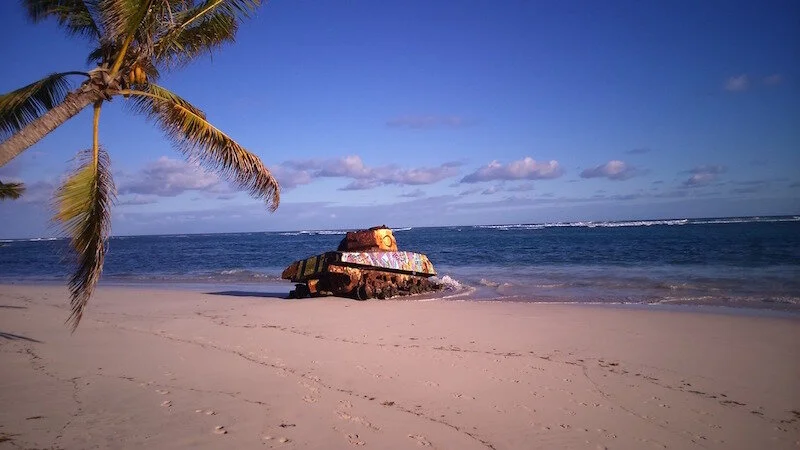
Flamenco Beach or “Tank Beach” on the island of Culebra, Puerto Rico.
If a Puerto Rican moves to a U.S. state can they vote?
United States citizens can freely reside in any of the 50 states and are automatically conferred the same rights, such as voting, as any other citizen (Puerto Ricans were granted U.S. citizenship by the Jones Act of 1917).
People born in Puerto Rico are U.S. citizens by birth. But because Puerto Rico, like Guam and the U.S. Virgin Islands, is not part of the 50 states or D.C., those who reside in Puerto Rico are not allowed to vote for the President or to elect a voting member of the United States. Those who move from Puerto Rico to live in one of the 50 states or the District of Columbia can vote in federal elections.
Equal citizenship not equal places
This process also works in reverse. Once a mainlander moves to Puerto Rico, and establishes residency, they lose their right to vote in organized Federal Government elections.
During the 2020 presidential election, Brock Peirce, an independent candidate, received nearly 50,000 popular votes. Brock Pierce, originally from Minnesota and a full-time Puerto Rican resident since 2017, was eligible to run for President but is not eligible to vote for the U.S. presidency.

Playa Negra - Vieques (Puerto Rico)
Territory: Voting & Taxes
Voting rights or lack thereof is related to Puerto Rico’s classification as a commonwealth that functions as an unincorporated organized territory. While residents of Puerto Rico are ineligible to vote in federal elections, they also do not pay federal income tax.
This also applies to Guam, U.S. Virgin Islands, and the Northern Mariana Islands.

Puerto Rico, 1,014 miles from Miami, Florida, and 1,557 miles from Washington D.C. (Image Source: Garrett)
Voting Rights: States
Article 1, Section 2 of the United States Constitution could not be any clearer:
“The House of Representatives shall be composed of Members chosen every second Year by the People of the several States, and the Electors in each State shall have the Qualifications requisite for Electors of the most numerous Branch of the State Legislature.”
Puerto Rico is a commonwealth or territory and is NOT a U.S. state. As such, citizens of the island are not represented in the U.S. House of Representatives.

Jesse is the Director of Pedal Chile and lives in La Patagonia and Puerto Rico. Jesse has a Master of Science in Health and Human Performance and a Bachelor of Science in Kinesiology. Hobbies: Mountain biking, bicycle commuting, reading, snowboarding, researching, and sampling yummy craft beers.


Sources & References
Cotter, Daniel. “Territories of the United States – Constituting America.” Constitutingamerica.org, constitutingamerica.org/territories-of-the-united-states-guest-essayist-daniel-a-cotter/.
Franqui-Rivera, Harry. “National Mythologies: U.S. Citizenship for the People of Puerto Rico and Military Service.” Memorias: Revista Digital de Historia Y Arqueología Desde El Caribe, no. 21, 2013, pp. 5–21.
Fortier, John C. “The Constitution Is Clear: Only States Vote in Congress.” Www.yalelawjournal.org, 19 May 2007, www.yalelawjournal.org/forum/the-constitution-is-clear-only-states-vote-in-congress.
Garrett, R. Sam. “‘Political Status of Puerto Rico: Brief Background and Recent Developments for Congress.’” UNT Digital Library, 12 June 2017, digital.library.unt.edu/ark:/67531/metadc990757/.
Román, José. “Puerto Rico and a Constitutional Right to Vote.” Academic.udayton.edu, Apr. 2002.
Venator-Santiago, Charles. “Interest Convergence and the Extension of U.S. Citizenship to Puerto Rico.” University of Miami Race & Social Justice Law Review, vol. 9, no. 1, 7 Aug. 2019, p. 111, repository.law.miami.edu/umrsjlr/vol9/iss1/7/.
Vézina, Valérie. “Navigating Citizenship and National Identity in American Territories: Nationalism in American Samoa and Puerto Rico.” Shima: The International Journal of Research into Island Cultures, vol. 14, no. 2, 23 Sept. 2020, 10.21463/shima.14.2.12.