Why does the back of my knee hurt when I ride a bike

high bicycle seat.jpg

Seat-to-Pedal Distance, commonly called Saddle Height, is responsible for how efficient your power production is and directly affects your joint angles and the ranges of motion of your muscles. 

  • Pain in the back of the knee commonly results from cycling with your saddle positioned too high. This pain is the result of your legs over-extending during each pedal stroke which results in an overstretch of the tendon that connects the muscles of your hamstring to your tibia.


Seat way too high: An example

seat way to high.jpg

Most likely he is taking his dad’s bike out for a stroll….. but notice how he can barely touch the pedals and is only “toeing” them even before reaching bottom dead center??

  • This is an example of a saddle that is way too high. Frequent cycling with this saddle position will cause pain in the back of the knee and a host of other pain issues.


Anatomy of the Knee


Image Source: Wikimedia Commons


General Bike Fit Rules of Thumb

  • Pain in the BACK of the KNEE = cycling with SEAT TOO HIGH

  • Pain in the FRONT of the KNEE = riding with SADDLE TOO LOW


A) Saddle Too High

pelvic+drop.jpg
 
  • A) Saddle positioned too high which causes the cyclist to reach further to push on the pedal.

  • B) However, eliminating all pelvic motion is not ideal either, because the pelvic motion helps transfer power from the upper torso to your lower limbs (Image Source: Leavitt and Vincent)


Causes of posterior knee pain: Saddle Too High


If the hips rock back and forth when pedaling, the saddle is too high
— From the" PHYSICIAN AND SPORTS MEDICINE"


Saddles that are too high or too far back can over-stress the hamstring muscles. Posterior knee pain (pain behind the knee) develops from cycling with too high of a saddle and manifests as either biceps femoris tendonitis (biceps tendinosis) or popliteus tendinitis.

  • Either way, your hamstring muscles are being over-extended and pulled, which results in pain in the hamstring or where your muscle inserts around your knee.

  • Excessive internal rotation of your cleats (feet pointed toward the bike) will also increase the stress on this tendon and can manifest as posterior knee pain.


READ:Is My Saddle Too Far Back” if you would like more info about your fore/aft position.


Biceps tendonitis is another common over-use injury in cyclists and can be caused by a saddle height that is too high. If the saddle is too high it can cause posterior knee pain by over-extension in the dead spot at the bottom of the stroke, which puts a heavy strain on the biceps femoris. Due to this, it has been recommended that the saddle height be set between a 25-35°
— From the Journal of Exercise Physiology


Fixing posterior knee pain

If you are experiencing pain in the back of your knee(s), your first step is to analyze your saddle height and also check your fore/aft seat position. Having your saddle too far back, effectively raises your saddle height, since this places you further away from the pedals.

  1. Check your saddle height

  2. See if your saddle fore/aft position is correct

cycling graphic.png
 

Self Care & Knee Pain

  • Apply ice to the inflamed area in 15-minute intervals

  • Foam roll surrounding muscles (but not on the area of pain or inflammation)

  • Rest: Don’t go cycling

  • Get a professional BikeFitting to avoid injuries in the future and improve comfort and performance and correct current issues

If rest, foam rolling, and icing fail to alleviate your knee pain, then it’s time to speak to a trained medical professional, such as a physical therapist.

Preventing Knee Pain

Graphic of the relative frequency of injuries in various areas from a 1995 edition of the British Journal of Sports Medicine(Image Source: Callaghan and Jarvis)

Graphic of the relative frequency of injuries in various areas from a 1995 edition of the British Journal of Sports Medicine

(Image Source: Callaghan and Jarvis)


Bicycling is highly repetitive. Just cycling 1,000 miles per year can take over one-million pedal strokes. Any slight misalignment of your bicycle settings, such as improper saddle height, create a cascading effect of issues, such as knee pain.

In the above graphic from a 1995 edition of the British Journal of Sports Medicine, the knee and low back suffer the most injuries. Both lower back and knee injuries are highly influenced by your seat to pedal distance (saddle height).

Even though this graphic is over 25 years old, it’s still reflective of the most common injuries today. If you are uncomfortable or experiencing any pain, these are signs you need to tweak your bike settings.

Preventing hamstring pain and cycling injuries can be as simple as checking your Bike-Fit settings. Proper saddle height, cleat position, and handlebar setup are very important in creating a comfortable and healthy ride.

quick summary

  • Saddle Too High: Posterior knee pain most commonly commonly results from cycling with too high of a saddle position (unless you happen to ride a fixie*)

  • Saddle Too Far Back: Riding with your saddle too far back places you further from the pedals which effectively raises your seat and can result in pain in the back of your knees

  • Solutions: Lower your saddle or move it forward (or both). If you are unsure how to find your correct saddle height, then seek a professional or check out our video.


* A “fixie” or fixed-gear bicycle can cause hamstring injuries since you use your hamstrings to slow/stop the bike.


about jesse.png

Jesse is the Director of Pedal Chile and lives in La Patagonia. Jesse has a Master of Science in Health and Human Performance and a Bachelor of Science in Kinesiology. Hobbies: Mountain biking, bicycle commuting, reading, snowboarding, researching, and sampling yummy craft beers.


More articles from Pedal Chile


Sources and References

  1. Asplund C, St Pierre P. Knee pain and bicycling: fitting concepts for clinicians. Phys Sportsmed. 2004 Apr;32(4):23-30. doi: 10.3810/psm.2004.04.201. PMID: 20086406

  2. “Biceps Femoris Tendinopathy - Knee Tendinopathy - Knee - Conditions - Musculoskeletal - What We Treat - Physio.co.uk.” Www.physio.co.uk, www.physio.co.uk/what-we-treat/musculoskeletal/conditions/knee/knee-tendinopathy/biceps-femoris-tendinopathy.php.

  3. Callaghan, Michael J. “Lower Body Problems and Injury in Cycling.” Journal of Bodywork and Movement Therapies, vol. 9, no. 3, 1 July 2005, pp. 226–236, www.sciencedirect.com/science/article/abs/pii/S1360859205000124, 10.1016/j.jbmt.2005.01.007.

  4. Callaghan, M J, and C Jarvis. “Evaluation of Elite British Cyclists: The Role of the Squad Medical.” British Journal of Sports Medicine, vol. 30, no. 4, 1 Dec. 1996, pp. 349–353, 10.1136/bjsm.30.4.349. ‌

  5. EFFECTS of SADDLE HEIGHT on PERFORMANCE and MUSCULAR ACTIVITY during the WINGATE TEST.” Journal of Physical Education, vol. 28, no. 1, 2017, 10.4025/jphyseduc.v28i1.2838.

  6. Johnston, Therese E et al. “THE INFLUENCE OF EXTRINSIC FACTORS ON KNEE BIOMECHANICS DURING CYCLING: A SYSTEMATIC REVIEW OF THE LITERATURE.” International journal of sports physical therapy vol. 12,7 (2017): 1023-1033. doi:10.26603/ijspt20171023

  7. Korff, Thomas, et al. “Effect of ‘Pose’ Cycling on Efficiency and Pedaling Mechanics.” European Journal of Applied Physiology, vol. 111, no. 6, 3 Dec. 2010, pp. 1177–1186, link.springer.com/article/10.1007%2Fs00421-010-1745-7, 10.1007/s00421-010-1745-7.

  8. Leavitt, Trevor G., and Heather K. Vincent. “Simple Seat Height Adjustment in Bike Fitting Can Reduce Injury Risk.” Current Sports Medicine Reports, vol. 15, no. 3, 2016, p. 130, 10.1249/jsr.0000000000000254.

  9. Peveler, Will W. “The Effect of Saddle Height on Economy in Highly Trained Cyclists.” Medicine & Science in Sports & Exercise, vol. 41, May 2009, p. 10, 10.1249/01.mss.0000353288.18971.8d.

  10. Peveler WW, Green JM. Effects of saddle height on economy and anaerobic power in well-trained cyclists. J Strength Cond Res. 2011 Mar;25(3):629-33. doi: 10.1519/JSC.0b013e3181d09e60. PMID: 20581695.

  11. Pruitt, Andrew L, and Fred Matheny. Andy Pruitt’s Complete Medical Guide for Cyclists. Boulder, Colo., Velopress, 2006.

Why are the seasons reversed in the Southern Hemisphere

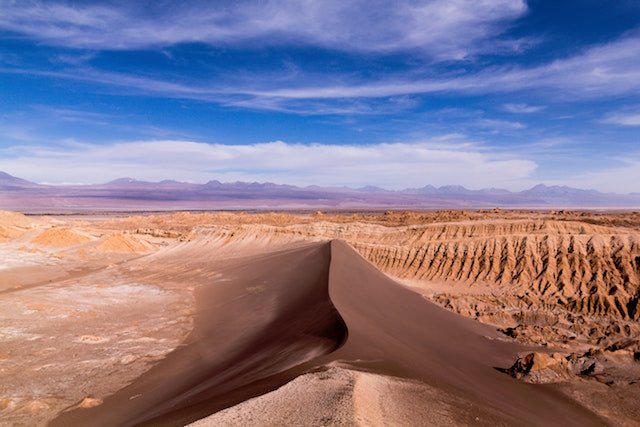
Picture taken in South America’s Atacama Desert (Figure 1)

Picture taken in South America’s Atacama Desert (Figure 1)


The Earth rotates about an imaginary line that passes through the north and south poles of the planet.

  • This imaginary line is called the axis of rotation and ALWAYS points in the same direction

    • The North Pole always points toward the star Polaris, commonly called the North Star

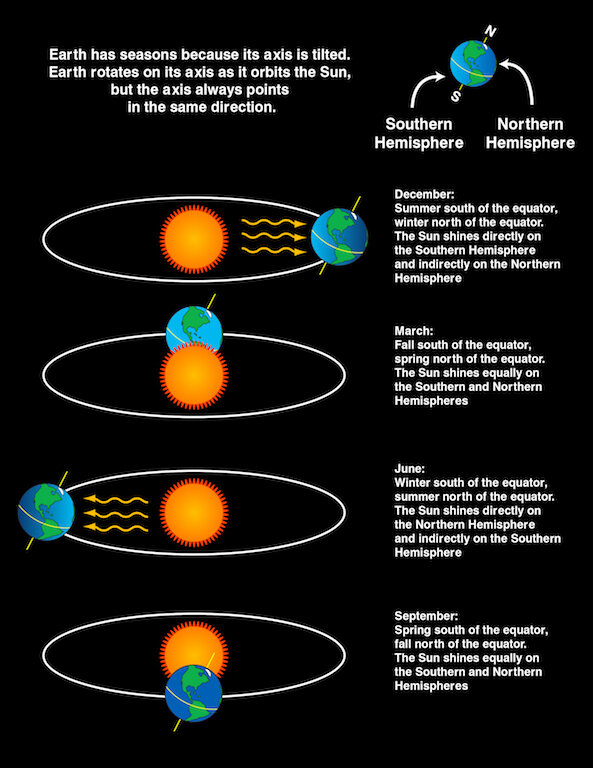
Think of the Earth as a spinning top, that is tipped to one side, at an angle of 23.45 degrees. The tilt of the Earth and the Earth’s orbit work together to create the seasons.


The axis of rotation and the North Star (Polaris). The Earth’s tilt on its axis leads to one hemisphere facing the Sun more than the other hemisphere and gives rise to seasons.

The axis of rotation and the North Star (Polaris). The Earth’s tilt on its axis leads to one hemisphere facing the Sun more than the other hemisphere and gives rise to seasons.


The Tilt of The Earth: The Sun & The Seasons

As the Earth travels around the Sun, it remains tipped in the same direction toward the North Star. When the northern half (Northern Hemisphere) of the Earth is pointing towards the Sun (summer), the southern half (Southern Hemisphere) is tilted away from it (winter).

  • Notice that when the Northern Hemisphere is tilted towards the Sun, the Southern Hemisphere is tilted away from it, and explains why the hemispheres have opposite seasons.

Image Source: Wikimedia Commons

Image Source: Wikimedia Commons


Southern Hemisphere Summer

The summer solstice in the Southern Hemisphere happens on December 21st or 22nd. This is the day that the tilt of the Earth’s axis, maximally points toward the Sun in the Southern Hemisphere.

  • When it’s the summer solstice in the Southern Hemisphere, it’s the winter solstice in the Northern Hemisphere

  • The Sun’s rays more directly strike the Tropic of Capricorn in the Southern Hemisphere during summer


Summer Solstice in the Southern Hemisphere

Notice the rays from the Sun striking the Tropic of Capricorn more directly in the Southern Hemisphere summer?? Also, notice the southern hemisphere tilting towards the Sun, leaving the Northern Hemisphere in winter. (Figure 2)

Notice the rays from the Sun striking the Tropic of Capricorn more directly in the Southern Hemisphere summer?? Also, notice the southern hemisphere tilting towards the Sun, leaving the Northern Hemisphere in winter. (Figure 2)


Southern Hemisphere Winter

The winter solstice in the Southern Hemisphere happens on June 21st or 22nd. This is the day the Earth has maximally tilted away from the Sun in the Southern Hemisphere.

  • In the Northern Hemisphere, the North Pole is tilted towards the Sun, with the Sun’s rays striking the northern half more directly in the northern summer.


Winter Solstice in the Southern Hemisphere

Notice how the Earth’s axis is tilted toward the sun in the northern half, which leaves the southern hemisphere in winter? (figure 3)

Notice how the Earth’s axis is tilted toward the sun in the northern half, which leaves the southern hemisphere in winter? (figure 3)


Is there a North Star equivalent in the Southern Hemisphere?

There is no true equivalent. Sigma Octantis, based on position, could be considered the “South Pole Star,” however, unlike Polaris (North Star) it’s too dim to be used as a consistent celestial reference point.

  • Sigma Octantis is also over a degree away from the true south pole


about jesse.png

Jesse is Director of Pedal Chile and lives in La Patagonia (southern hemisphere). Jesse has a Master of Science in Health & Human Performance and a Bachelor of Science in Kinesiology. Hobbies: Mountain biking, snowboarding, reading, taster of craft beers, researcher, & star-gazer.


Sources :

  1. Duro/ESO, A. “English: Science and Art Unite in This Beautiful Photograph, Taken in Chile’s Atacama Desert by ESO Photo Ambassador Adhemar M. Duro Jr. To Create This Visual Masterpiece Adhemar Pointed His Camera at the Sky’s South Pole, the Point at the Centre of All the Bright Arcs and Circles. All the Stars in the Night Sky Revolve around This Point. Over a Period of Several Hours, This Motion Creates Star Trails, with Each Individual Star Tracing out a Circle on the Sky. These Trails Display the Various Brightnesses and Colours of Each Star, Creating a Captivating Scene! Towards the Top Left of the Image, You Can See a Short, Bright Streak of Light Cutting across the Trails — This Is Caused by a Meteor, Burning up in a Flash of Light as It Enters Earth’s Atmosphere. The Desert’s Harsh and Arid Landscape, Illuminated Here by the Light from the Stars….” Wikimedia Commons, 1 Aug. 2016, commons.wikimedia.org/wiki/File:All_In_A_Spin_Star_trail.jpg. (Figure 1)

  2. “File:Earth-Lighting-Summer-Solstice EN.png - Wikimedia Commons.” Commons.wikimedia.org, commons.wikimedia.org/wiki/File:Earth-lighting-summer-solstice_EN.png. (Figure 3).

  3. “File:Earth-Lighting-Winter-Solstice EN.png - Wikimedia Commons.” Commons.wikimedia.org, commons.wikimedia.org/wiki/File:Earth-lighting-winter-solstice_EN.png. (Figure 2).

  4. Shaw, Justin. “Justin Shaw, Beaverton, Oregon. “Is there an equivalent to the North Star in the Southern Hemisphere?” Astronomy.com, 26 May 2009.

  5. “What Causes the Seasons? | NASA Space Place – NASA Science for Kids.” Nasa.gov, 2016, spaceplace.nasa.gov/seasons/en/.

  6. “Why Does Earth Have Seasons? | NOAA SciJinks – All about Weather.” Scijinks.gov, scijinks.gov/earths-seasons/.

Hottest Countries in the World - Top 10

6 of the top 10 hottest countries are located in Africa and near or in the Sahara Desert (Image Source: Wikimedia Commons)

6 of the top 10 hottest countries are located in Africa and near or in the Sahara Desert (Image Source: Wikimedia Commons)


Although all of the Earth’s countries located away from the equatorial regions experience seasons, some with winters and summers that are more extreme than others. There are plenty of areas on Earth that spend the whole year in incredibly hot temperatures, as these 10 countries are the hottest on Earth.

  • Calculated by averaging their maximum and minimum daily temperatures, recorded between 1961 and 1990

  • All of these are either located on the African continent, or are island nations in the Indian and Pacific Oceans.


10)   Benin – 81.59°F (27.55°C)

Image Source: Wikimedia Commons


Located in western Africa, Benin is bordered by Nigeria on the east and Togo on the west.

The majority of its population lives on its southern side, which borders the Bight of Benin, part of the northernmost tropical part of the Atlantic Ocean. The country’s interior is mainly made up of a savannah-type environment.

  • Highest recorded temperature in Benin = 113°F (45°C)

  • Average yearly daytime temperature: 91.4°F (33°C)

Atakora - a village in Benin (Image Source: Wikimedia Commons)


9)   Palau – 81.68°F (27.60°C)

Image Source: Wikimedia Commons


Palau is an island nation that is situated in the western Pacific Ocean, with the islands of the Philippines to the east, and Indonesia to the south. Located between 2.8°and 8° north of the Equator, this is a great example of a tropical island that experiences a guaranteed warm and humid climate all year round.

However, another factor comes into play in terms of maintaining the heat – the warm temperature of the surrounding Pacific Ocean ensures that temperatures do not drop quickly at night after spending a day being heated by the overhead Sun.

  • Hottest recorded temperature = 95°F (35°C)

  • Average yearly daytime temperature: 87°F (31°C)

    • At night, the average temperature does not drop by more than 10°F (5.5 °C)

  • Annual average dew point temperature: 76°F (24.4°C) which is over 13% more humid than the most humid city in the United States (Key West, FL)

Palau archipelago (Image Source: Wikimedia Commons)


8)   Maldives – 81.77°F (27.65°C)

Image Source: Wikimedia Commons


Located in the Indian Ocean to the south-west of India and Sri Lanka, the Maldives are a chain of small islands that are around 541 miles (870 km) in length. With its capital Malé, situated at around 4.2° north of the Equator, it is not surprising that these islands experience incredibly warm and humid weather on a constant basis.

  • The Republic of Maldives are 300 miles south-west of India

  • Maximum elevation of the entire island chain = 2 meters

  • Highest recorded temperature = 99°F (37°C)

  • Average yearly daytime temperature: 86°F (30°C)

The Maldives archipelago consists of 1192 islands, most of which are so tiny you can spot the ocean from any spot.

The Maldives archipelago consists of 1192 islands, most of which are so tiny you can spot the ocean from any spot.


7)   Mauritania - 81.77°F (27.65°C)

Image Source: Wikimedia Commons


Located in north-western Africa, it is understandable that Mauritania has such a high average temperature – much of it lies within the Sahara Desert, with the semi-arid Sahel region across the south of the country.

Bordered by Senegal to the south, Mali to the south and east, and the countries of Algeria and Western Sahara to the north, the western side of the country is most likely to be the coolest area, since it borders directly onto the Atlantic Ocean.

  • Yearly daily temperature ranges from 55°F to 104°F (13°C to 40°C)

  • Hottest recorded temperature in Mauritania = 119°F (48°C)

  • Average daytime temperature exceeds 100°F (38°C) over half the year

Terjît valley in Mauritania

Terjît valley in Mauritania


6)   Senegal – 82.13°F (27.85°C)

Image Source: Wikimedia Commons


With its northern section within the Sahel region, and a savannah landscape typifying much of the central and southern parts of the country, Senegal is placed at number six on this list.

Located in western Africa to the south of Mauritania, west of Mail and the north of Guinea, Senegal is in a prime position to receive hot weather.

Its close position to the Equator ensures that the country receives a hot climate on a constant basis. 

  • Hottest recorded temperature in Senegal = 123°F (50.5 °C)

  • Average yearly daytime temperature exceeds 93°F (34°C) for the interior of the country

Saloum Delta National Park, Senegal

Saloum Delta National Park, Senegal


5)   Tuvalu – 82.40°F (28.00°C)

Image Source: Wikimedia Commons


Tuvalu is a country that is made up of 9 separate coral islands in the south-western Pacific Ocean, located around halfway between Australia and Hawaii.

Being surrounded by warm tropical waters, and situated at a latitude between -10° and -5° North, the conditions are perfect to allow for hot days and warm, humid nights, regardless of the time of year.

  • 4th smallest nation in the world

  • Maximum elevation is 5 meters

  • Average temperature lies between 77ºF to 88°F (25ºC to 31ºC)

  • Rainfall varies from 2,700 mm per year in the northern islands to 3,500 mm in the southern

  • Highest recorded temperature in Tuvalu = 106°F (41°C)

  • Lowest recorded temperature = 68°F (20°C)

  • Yearly average dew-point of Funafuti (capital city): 77°F (25°F) or 3% more humid than Bangkok, Thailand.

Tuvalu Funafuti Atoll (Image Source: Wikimedia Commons)


 4)   Djibouti – 82.40°F (28.00°C)

Image Source: Wikimedia Commons

Situated on the northern side of the Horn of Africa, Djibouti is an incredibly arid country that consists of almost entirely desert areas.

  • Bordered by Somalia, Ethiopia and Eritrea, the country is located on the western end of the Gulf of Aden, which links to the Red Sea via the Bab al-Mandab Strait.

  • Due to being around 12° to the north of the Equator, Djibouti endures incredibly hot weather.

During the hot months, May to September, the temperature ranges from 97°F to 117 °F (36°C to 47 °C)

  • Highest recorded temperature in Djibouti = 115°F (46°C)

  • Lowest recorded temperature = 61°F (16°C)

Djibouti City, Djibouti

  • Summer daytime temperatures hover around 104°F (40°C), while at night, they drop to 86°F (30°C) in the country's capital

Lake Abha in Djibouti. This is a salt lake.

Lake Abha in Djibouti. This is a salt lake.


3)   Kiribati – 82.76°F (28.20°C)

Image Source: Wikimedia Commons

The climate of Kiribati is hot and humid, with very little variation in maximum and minimum temperatures throughout the year.
— International Journal of Environmental Research and Public Health


An island nation in the central Pacific Ocean, Kiribati consists of 9 different islands that straddle the Equator line. With the Sun almost directly overhead the entire year, and the warm and tropical Pacific waters surrounding the islands, the ingredients are perfect in allowing for year-round heat and humidity. 

Christmas Island and lagoon in Kiribati

Christmas Island and lagoon in Kiribati

  • The average elevation is less than 3 meters above sea level

  • Highest recorded temperature = 113°F (45°C)

  • The average yearly daytime temperature: 88°F (31°C)

  • Tarawa, the capital city of Kiribati is one of the most humid cities in the world and has an annual average dew point temperature of 75.4°F | 24.1°C which is even muggier than Bangkok, Thailand yearly average of 74°F | 23.3°C


 2)   Mali – 82.85°F (28.25°C)

Image Source: Wikimedia Commons

Mali (Image Source: The World Factbook)

Mali, the second hottest nation in the world, is a landlocked country in western Africa, bordered by several countries including Mauritania, Senegal and Burkina Faso, which are also on this list.

Although the south-east of the country has a savanna-like landscape, much of the south lies within the Sahel region. However, the large northern extent of Mali lies within the Sahara Desert, with scorching hot days occurring for most of the year, peaking far above 110°F (43°C) between the months of June and September.

Combined with the hot and humid conditions of the savanna along the south of Mali, as well as the lack of fresh sea breezes, results in a country that suffers through incredibly stifling temperatures.

  • Mali is twice the size of the state of Texas (USA) and mostly lies in the Sahara Desert.

  • Highest recorded temperature = 130°F (54°C)

  • Average yearly daytime temperature: 88°F (31°C)

  • The average daytime temperature ranges from low 80s to low 100s°F (28 to 40°C)

Village Telly in Mali (Image Source: Wikimedia Commons)


1)     Burkina Faso – 82.92°F (28.29°C)

Image Source: Wikimedia Commons

  • The country with the highest average temperature on Earth, Burkina Faso, is a landlocked country in western Africa that borders the second hottest country of Mali.


Image Source: The World Factbook

In terms of its landscape, it can be loosely divided into two halves – with the south of the country being characterised by a savanna landscape, and the northern half consisting of the semi-arid Sahel region, Burkina Faso contains plenty of dryland environments.

  • The lack of a coastline close to the country also prevents any relatively cooler air from reaching the country from the Atlantic Ocean, which is located around 300 miles (480 km) to the south.  

  • Highest recorded temperature = 117 °F (47°C)

Burkina Faso: 3 Climate Zones

  1. Hot tropical savanna with a short rainy season (southern half)

  2. Tropical hot semi-arid steppe climate (central and northern)

  3. Small, hot desert in the north that borders the Sahara Desert

Village in Burkina Faso - The hottest country on the Earth

Village in Burkina Faso - The hottest country on the Earth


Bottom Line

Burkina Faso, a landlocked Sahelian country, is the hottest country in the world - with an average daily temperature of 83°F (29°C).

  • Located in the Sahara Desert, this western Africa nation gets blasted by heat, from the harmattan, a dry east wind that picks up a considerable amount of dust and heat from the Sahara.

  • Ouagadougou, the capital of Burkina Faso, averages over 100°F (38°C) from March to May in the hot season. During the “cool” season, the temperature drops to an average of 90°F (32°C).

    • For comparison, this is nearly 20% warmer than Bangkok, Thailand.


valentina - bio pic copy.jpg

Valentina is a guide for Pedal Chile and is our geology expert. Valentina has been in love with geology ever since she first saw Villarrica glowing in her native country of Chile. Valentina was born and raised in La Patagonia, which probably explains her affinity for adventuring. When Valentina isn’t crushing some poor dude’s soul, you can find her shredding down Rucapillán. Favorite season: Austral Summer 


More articles from Pedal Chile


References and sources for hottest countries:

  1. “Climate and Temperature Development.” Worlddata.info. www.worlddata.info

  2. Fall, Souleymane, et al. “Analysis of Mean Climate Conditions in Senegal (1971–98).” Earth Interactions, vol. 10, no. 5, 1 Jan. 2006, pp. 1–40, 10.1175/ei158.1.

  3. “Harmattan.” Wikipedia, 8 Jan. 2021, en.wikipedia.org/wiki/Harmattan. Accessed 6 Feb. 2021.

  4. “Hottest Countries in the World 2021.” Worldpopulationreview.com, worldpopulationreview.com/country-rankings/hottest-countries-in-the-world.

  5. Idriss, Abdoulkader Ibrahim & Ahmed, Ramadan & Kassim, Rima & Idris, Abdou & Barutcu, Burak & Awalo, Abdoulhamid & AKINCI, T. Cetin. (2019). Suitability and evaluating wind speed probability distribution models in a hot climate: Djibouti case study. International Journal of Renewable Energy Research. 9. 1-11.

  6. Madaleno, I.M. (2011). Climate change in the Pacific: Tuvalu case-study. WIT Transactions on Ecology and the Environment. 144. 243-252. 10.2495/ECO110221.

  7. McIver, Lachlan; Woodward, Alistair; Davies, Seren; Tibwe, Tebikau; Iddings, Steven. 2014. "Assessment of the Health Impacts of Climate Change in Kiribati" Int. J. Environ. Res. Public Health 11, no. 5: 5224-5240. https://doi.org/10.3390/ijerph110505224

  8. Naia, Marisa & Brito, José. (2021). Geographical Atlas of Mauritania.

  9. “This Month in Climate History: Earth’s Hottest Temperature | National Centers for Environmental Information (NCEI) Formerly Known as National Climatic Data Center (NCDC).” Noaa.gov, 2012, www.ncdc.noaa.gov/news/month-climate-history-earth%E2%80%99s-hottest-temperature.

  10. “Where Is the Hottest Place on Earth?” Earthobservatory.nasa.gov, 5 Apr. 2012, earthobservatory.nasa.gov/features/HottestSpot.

The Driest Desert in the World

El Valle de la Luna or Valley of the Moon in the Atacama Desert, Chile - South America.

El Valle de la Luna or Valley of the Moon in the Atacama Desert, Chile - South America.


What is a desert?

Defined as a large expanse of land that is extremely dry, and consists of either no vegetation, or limited areas that are vegetated, deserts make up a significant part of the Earth’s landscape.

Over one-third of the Earth's land surface is desert and at least one desert is found on all of the continents, including the Tabernas Desert in Europe.


Valle de la Luna in San Pedro de Atacama, Chile


Reasons for Deserts

They are caused by a number of factors, which include permanent areas of high air pressure preventing rain from developing over an area, rain shadow effects, and even because an area of land is too far away from large water bodies to receive rain.

The variety of different factors also means that some deserts are drier than others, ranging from semi-arid expanses of land through to hyper-arid areas, some of which have not seen measurable rain for hundreds of years.

Also, although many deserts around the world are located in hot and dry locations, and often consist of sand or rocks, some also exist in cold polar regions.


The Atacama: The Driest Warm Desert on Earth

 
The Atacama Desert is one of the most extreme environments on Earth. As the driest hot desert in the world, life here is extremely marginal.
— Quaternary Science Reviews


The Atacama desert in Chile, South America


If we are looking at the driest warm desert in the world – one which is rocky, sunny and receives hot days all year round, then the driest one is the Atacama Desert.

(Image Source: Clarke 2006)

(Image Source: Clarke 2006)

Making up the central section of the west coast of South America, the Atacama runs from the plateau of the Andes Mountains, and borders the Pacific Ocean on its western side. With a total area of 40,541 square miles (105,000 km2), it occupies the northern quarter of Chile, and small parts of Argentina, Bolivia and Peru. It contains a spectacular landscape of rocky plains, barren hills and the large mountains of the Andes on its eastern side.

Vast salt flats cover parts of the desert, the largest of these being Salar de Uyuni in the Bolivian section of the Atacama. Natural saltwater pools accumulate within some of the salt flats, often from groundwater that has risen to the surface.

Excluding polar regions, the Atacama is the driest desert in the world. Although the average rainfall across the whole desert is around 0.6 inches (15 mm) per year, some places within the Atacama barely record 0.1 inches (2.5 mm) of rainfall a year.

The small city of Calama, located in the heart of the desert, is one of the driest cities in the world, with an average annual precipitation of only 0.2 inches (5 mm). In 2015, parts of the hyper-arid core received unexpected rainfall; this is estimated to have been the first rain to land on those areas for at least 500 years.

Near the Chilean city of Calama (Image Source: Flickr)


The Atacama's extreme aridity is caused by three main factors:

  1. Rain shadow

  2. Prevailing high air pressure

  3. Cold Pacific Ocean current

1) Rain Shadow

Firstly, being located to the west of the Andes Mountains means that, when the prevailing south-easterly trade winds bring in moisture across the South American continent from the South Atlantic, they reach the Andes and rise. This results in the moisture condensing and falling on the eastern side of the Andes – very little of it reaches the Atacama side.

2) Prevailing High-air Pressure

Secondly, constant high air pressure over the region prevents moisture from falling over the region, and means that any moisture is converted into water vapor, and so cannot condense into rain.

atacama desert pic.jpg

3) Cold Pacific Ocean Current

However, the last factor is due to the cold Humboldt Current – running northwards along much of South America’s western coast, the current brings cold water up from the southern Pacific region, fairly close to Antarctica. This means that any onshore wind is chilled, and so it cannot pick up any moisture from the Pacific.

These three factors merge to create a perfectly dry storm – an incredibly arid region of South America.

The Atacama Desert

The Atacama Desert


 The McMurdo Dry Valleys, Antartica: Driest Place on Earth

Wright Valley in the McMurdo Dry Valleys, Antarctica - (Image Source: Wikimedia Commons)


The McMurdo Dry Valleys of Antarctica are an extreme environment. They comprise a large (4,000 km2) ice-free area considered to be the driest and coldest desert on Earth, limiting to the survival of many forms of life
— Polar Biology


Although the Atacama is the driest warm desert on Earth that fits the definition of a warm, rocky and sunny desert, there is one place on Earth which is even drier – The McMurdo Dry Valleys in Antarctica, the driest place on Earth.

  • Located around 2,000 miles (3,400 km) to the south of New Zealand, these valleys consist of a 1,850 square mile (4,800 km2) area that is completely barren of any ice or snow.

  • Cold air holds less water vapor than warm air

    • Air at freezing temperature (32°F) holds 10 times less moisture than air at 100°F

    • Air at 32°F holds about 20 times less moisture than air at 130°F

    • Average temperature of the Mcmurdo Dry Valleys = -16°F/-27°C

  • The McMurdo Dry Valleys have not seen rain for nearly 2 million years

Bull Pass in McMurdo Dry Valleys (Image Source: Wikimedia Commons)

Bull Pass in McMurdo Dry Valleys (Image Source: Wikimedia Commons)

Katabatic Winds: Antarctica

This is due to the presence of mountains to the south and west of the valleys, which cause katabatic winds to form.

This means that cold air is dragged down from the ice-covered region that overlooks the valleys, and in turn warms up. These strong katabatic winds cause any ice or snow that has slid or drifted into the dry valleys region to evaporate.


Katabatic Winds (Image Source: Wikimedia Commons)

What are Katabatic Winds?

  • Katabatic Winds = winds that blow down slopes that are cooled by radiation

    • Strong winds that are a climatic feature of Antarctica

    • Winds caused by cold denser air falling down the slope of the Antarctic continent

    • Katabatic Winds average 45-mph (72kph)

      • Katabatic winds have been recorded approaching 150-mph (241-kph)

Katabatic wind is a gravity flow maintained by the temperature/density difference of the air in the surface layer when compared with the free air temperature at the same altitude further down the slope.


McMurdo Dry Valleys: Zero Rain

Very little precipitation falls in the region. No rain has fallen in the region for nearly two million years, and snow falls are very little, with an average of 4 inches (10cm) falling in the valleys per year.

Image Source: (Dreesens et al.)

A combination of the aforementioned katabatic winds, overlooking mountains and incredibly cold temperatures prevents more measurable amounts of snow from falling, and the strong and dry winds prevent any rare meltwater from sinking far into the soil.

Therefore, although the Atacama Desert is drier in terms of annual precipitation levels being lower, the McMurdo Dry Valleys have been completely barren of any rainfall for a far longer time.

The McMurdo Dry Valleys, with a combined area of approximately 4800 km2, is the largest ice-free area in Antarctica. This region was discovered by members of Robert Falcon Scott’s party during their 1903 expedition to reach the South Pole.


bottom line

The Atacama is the driest non-polar desert in the world while the McMurdo Dry Valleys is the coldest polar desert on planet Earth. Both places are thought to resemble Mars and are both used as training grounds for astronauts.


valentina - bio pic copy.jpg

Valentina is a guide for Pedal Chile and is our geology expert. Valentina has been in love with geology ever since she first saw Villarrica glowing in her native country of Chile. Valentina was born and raised in La Patagonia, which probably explains her affinity for adventuring. When Valentina isn’t crushing some poor dude’s soul, you can find her shredding down Rucapillán. Favorite season: Austral Summer


More articles from Pedal Chile


Sources and references

  1. Cain, Fraser. “What Is the Driest Place on Earth?” Universe Today, 12 June 2008, www.universetoday.com/15031/driest-place-on-earth/.

  2. California Academy of Sciences. “The Desert Biome.” Berkeley.edu, 2019, ucmp.berkeley.edu/exhibits/biomes/deserts.php.

  3. Charlotte L. King, Andrew R. Millard, Darren R. Gröcke, Vivien G. Standen, Bernardo T. Arriaza, Siân E. Halcrow. “Marine resource reliance in the human populations of the Atacama Desert, northern Chile – A view from prehistory.Quaternary Science Reviews, Volume 182,2018, P. 163-174.

  4. Clarke, Jonathan D.A. “Antiquity of Aridity in the Chilean Atacama Desert.” Geomorphology, vol. 73, no. 1-2, Jan. 2006, pp. 101–114, 10.1016/j.geomorph.2005.06.008.

  5. Crits-Christoph, A., Robinson, C.K., Barnum, T. et al. Colonization patterns of soil microbial communities in the Atacama Desert. Microbiome 1, 28 (2013). https://doi.org/10.1186/2049-2618-1-28

  6. Doran, Peter T. “Valley Floor Climate Observations from the McMurdo Dry Valleys, Antarctica, 1986–2000.” Journal of Geophysical Research, vol. 107, no. D24, 2002, 10.1029/2001jd002045.

  7. Dreesens, Lisa, et al. “The Distribution and Identity of Edaphic Fungi in the McMurdo Dry Valleys.” Biology, vol. 3, no. 3, 30 July 2014, pp. 466–483, 10.3390/biology3030466.

  8. Friedlander, Blaine. “For Arid, Mars-like Desert, Rain Brings Death.” Phys.org, 14 Nov. 2018, phys.org/news/2018-11-arid-mars-like-peruvian-death.html.

  9. Juli Hennings, Juli, and Harry Lynch. “Exploring Earth’s Driest Deserts | EarthDate.” Www.earthdate.org, 2017, www.earthdate.org/exploring-earths-driest-deserts.

  10. Nkem, Johnson N., et al. “Wind Dispersal of Soil Invertebrates in the McMurdo Dry Valleys, Antarctica.” Polar Biology, vol. 29, no. 4, 27 Sept. 2005, pp. 346–352, 10.1007/s00300-005-0061-x.

  11. November 2013, Becky Oskin 01. “Antarctic Hills Haven’t Seen Water in 14 Million Years.” Livescience.com, 1 Nov. 2013, www.livescience.com/40890-antarctic-dry-valleys-no-water.html.

  12. Nylen, Thomas H., et al. “Climatology of Katabatic Winds in the McMurdo Dry Valleys, Southern Victoria Land, Antarctica.” Journal of Geophysical Research: Atmospheres, vol. 109, no. D3, 14 Feb. 2004, p. n/a-n/a, 10.1029/2003jd003937.

  13. Parish, Thomas R., and John J. Cassano. “The Role of Katabatic Winds on the Antarctic Surface Wind Regime.” Monthly Weather Review, vol. 131, no. 2, Feb. 2003, pp. 317–333, 2.0.co;2">10.1175/1520-0493(2003)131<0317:trokwo>2.0.co;2.

  14. Speirs, Johanna C., et al. “Regional Climate Variability Driven by Foehn Winds in the McMurdo Dry Valleys, Antarctica.” International Journal of Climatology, vol. 33, no. 4, 4 Apr. 2012, pp. 945–958, 10.1002/joc.3481.

What is the largest river in the world

Aerial view of the Amazon  - - - (Image Source: Wikimedia Commons)

Aerial view of the Amazon - - - (Image Source: Wikimedia Commons)


Although lists of the longest rivers in the world are often easy to find, they do not tell the reader much about how much water is discharged by the rivers.

  • This list details the five rivers in the world with the largest average discharge that is recorded at the mouth.


5) Madeira River, South America – 1.1 million cubic feet (31,200 m3) per second

Image Source: Wikimedia Commons


Flowing through the southern Amazon Rainforest, the Madeira River is a major waterway that is fed by a large watershed of over 500,000 square miles (1.3 million km2) in area.

Fed by a myriad of rivers, the Madeira flows into the River Amazon around 150 km to the east of Manaus with an average discharge of 1.1 million cubic feet (31,200 m3) per second.

The large water volume of the Madeira River is due to a few reasons:

  • Firstly, the size of the watershed, which contains a myriad of rivers that feed into the Madeira, and the fact that its western side drains part of the Andes Mountains.

  • However, the most important reason is due to the excessive rainfall within the region – being a tropical environment, extremely high rainfall totals occur over the Amazon rainforest.

  • Within the Madeira basin, the mean annual precipitation is around 78 inches (2,000mm), which provides the river with a massive amount of water all year round.


The Madeira River is the largest tributary of the Amazon River, with the largest catchment area, water volume, and sediment flow among its tributaries.

Madeira River


4)   Orinoco River, South America – 1.31 million cubic feet (37,000 m3) per second

Image Source: (Yepez et al.)


The Orinoco River is the fourth most voluminous river in the world, with a discharge rate of 1.31 million cubic feet (37,000 m3) per second recorded at its mouth, where it flows into the Atlantic Ocean.

It has a vast watershed that covers four-fifths of Venezuela and a quarter of Colombia – the southern section of the watershed is located within the northern reaches of the Amazon Rainforest.

Image Source: (Mora et al.)

The intense tropical rainfall which falls in the Orinoco Basin is the main reason for such a high river water volume - although the dense rainforest reduces water runoff rates to some degree, much of it ends up draining into the River Orinoco.

The large watershed size also contributes to its high river volume – with a vast 366,000 square mile (948,000 km2) watershed, there is plenty of intense rainfall that can run off into the Orinoco.

Furthermore, although the southern parts of the watershed consist of dense rainforest, the northern side tends to be of a more savannah-like landscape – the lack of trees allows high runoff rates to occur during periods of high rainfall.

The Orinoco River, near Puerto Ayacucho airport, Venezuela (Image Source)


3)   Ganges River, Asia – 1.34 million cubic feet (38,100 m3) per second

Image Source: (Singh et al.)


Flowing from the Himalayan Mountains, the Ganges crosses northern India, and meets the Indian Ocean via the Ganges delta, which straddles both India and Bangladesh.

With a length of 1,560 miles (2,510 km)], despite the Ganges being relatively shorter than a number of the world’s most renowned rivers, it is the river with the third highest discharge in the world.

  • Its large watershed is the main reason for this – draining one fourth of India, there is a vast area of land over which rainfall runoff can run into the river. To the south, large areas of land are used for agricultural purposes – with a lack of trees, rainfall quickly runs off towards the river.

  • The Himalayan Mountains – which lie to the north of the Ganges – also contribute to its high discharge. Many rivers that flow southwards from the mountains reach the Ganges, which therefore accumulates runoff from both precipitation and glacier meltwater.

Ganges River


Although rainfall rates are seasonal along the watershed, the intense monsoon rainfall – which occurs between June and September, also increases the discharge massively, which peaks towards the end of this period. 


2)   Congo River, Africa – 1.45 million cubic feet (41,200 m3) per second

Image Source: Wikimedia Commons


The second highest river in the world by volume, the Congo flows for 2,900 miles (4,700 km) through a large section of western and central Africa – rising in north-eastern Zambia and discharging into the Atlantic Ocean.

Much of its course runs through the Democratic Republic of the Congo, and it has a vast watershed that includes the Congo Basin rainforest, and a large portion of the highlands of the East African Rift system.

The size and nature of the watershed is partly responsible for the high discharge – with an area of 1,335,000 miles2 (3,457,000 km2) being drained by one river, and an area that includes drainage from vast savannah and highland areas that are often not forested, it is little surprise that the volume of water flowing through the mouth of the Congo is so large.

Congo River. Kisangani, Democratic Republic of Congo (Image Source: Flickr)


In addition, incredibly high rainfall rates – related to the fact that the river is located almost wholly within a tropical climate zone – also amplify the Congo’s discharge. The Congo Basin receives an average of 60 inches (1,500 mm) of rainfall per year – a great amount of this drains into the Atlantic.


 1)     Amazon River, South America – 7.38 million cubic feet (209,000 m3) per second

Image Source: Wikimedia Commons


Although the Amazon is the second longest river in the world, it is also – by a considerable amount – the largest river in the world by water volume and has over 4 times the discharge of the Congo River, the world’s second largest river.

Aerial view of the Amazon Rainforest, near Manaus, the capital of the Brazilian state of Amazonas, Brazil. (Image Source: Flickr)


  • The Amazon empties 7 million cubic feet of water in the ocean every second, which is more than the volume of water discharged by the next six largest rivers combined

    • The daily discharge at the mouth of the Amazon averages 4 billion gallons of water each and everyday

  • 16 - 18% of the world’s runoff to the oceans is discharged from the Amazon River

  • Not a single bridge crosses the Amazon

  • The Mississippi River, the largest river in North America, has 10 times less water volume than the Amazon

  • 4 of the 10 largest rivers on Earth in terms of water discharge and drainage area are located in the Amazon River Basin


The Amazon River Basin - - - (Image Source: Montanher et al.)


The Amazon flows for 4,000 miles (6,400 km) across much of South America, rising in southern Peru, in the Andes Mountains, and traveling westwards through the Amazon Basin for most of its route, after which it drains into the Atlantic Ocean in the east.

  • With an incredibly large 2.7 million square miles (7 million km2) drainage basin, that covers much of the Amazon Rainforest, and drains other areas (such as parts of the Andes Mountains), this is a large reason that explains such a high discharge at the mouth of the river.

  • The tropical climate of the region also contributes massively to this – with much of the Amazon Rainforest receiving between around 60 and 120 inches (1,500 and 3,000 mm) of rainfall per year, there is a constant supply of runoff water which drains from the Amazon watershed – the only outlet channel for this is the mouth of the Amazon River.


valentina - bio pic copy.jpg

Valentina is a guide for Pedal Chile and is our resident badass. Valentina was born and raised in La Patagonia, which probably explains her affinity for adventuring. When Valentina isn’t crushing some poor dude’s soul, you can find her shredding down Rucapillán. Favorite season: Austral Summer


More articles from Pedal Chile

References and sources

  1. https://www.researchgate.net/publication/226326945_Assessment_of_environmental_changes_in_the_Orinoco_River_delta#pf2

  2. https://www.britannica.com/place/Orinoco-River

  3. https://www.britannica.com/place/Ganges-River

  4. https://www.britannica.com/place/Congo-River

  5. https://www.britannica.com/place/Amazon-River

  6. https://wwf.panda.org/discover/knowledge_hub/where_we_work/amazon/about_the_amazon/

  7. Montanher, Otávio Cristiano, et al. “Temporal Trend of the Suspended Sediment Transport of the Amazon River (1984–2016).” Hydrological Sciences Journal, vol. 63, no. 13-14, 26 Oct. 2018, pp. 1901–1912, 10.1080/02626667.2018.1546387.

  8. Mora, Abrahan, et al. “Hydrological Control, Fractionation, and Fluxes of Dissolved Rare Earth Elements in the Lower Orinoco River, Venezuela.” Applied Geochemistry, vol. 112, Jan. 2020, p. 104462, 10.1016/j.apgeochem.2019.104462.

  9. Moreira-Turcq, P., Seyler, P., Guyot, J. L. & Etcheber, H. Exportation of organic carbon from the Amazon River and its main tributaries. Hydrological Processes 17, 1329–1344, https://doi.org/10.1002/Hyp.1287 (2003)‌

  10. Singh, Munendra, et al. “Geogenic Distribution and Baseline Concentration of Heavy Metals in Sediments of the Ganges River, India.” Journal of Geochemical Exploration, vol. 80, no. 1, Aug. 2003, pp. 1–17, 10.1016/s0375-6742(03)00016-5.

  11. Yepez, Santiago, et al. “Retrieval of Suspended Sediment Concentrations Using Landsat-8 OLI Satellite Images in the Orinoco River (Venezuela).” Comptes Rendus Geoscience, vol. 350, no. 1-2, Jan. 2018, pp. 20–30, 10.1016/j.crte.2017.08.004.  

What Is The Widest Country In The World

world-political.jpg

Although you will often find lists of the world’s largest countries, this article details the world’s longest countries, based on measuring each one from the most easterly point to the most westerly. Several countries span a considerable distance around the globe, and sometimes have a significantly longer lateral distance than a north to south one.

In this list, I rank the widest countries in the world from east to west.

10)  Kazakhstan – 1,820 miles (2,929 km)

Image Source: Wikimedia Commons

Bordering China to its east, and Russia to its north and east, Kazakhstan spans a significant proportion of Central Asia.

Its landscape consists mainly of steppe plains, which occupy a large amount of its land area – however, deserts also dominate the south and south-west of the country, as does the large Caspian Sea.

  • 10)  Kazakhstan – 1,820 miles (2,929 km)


9)     India – 1,822 miles (2,932 km)

Image Source: Wikimedia Commons

From its easternmost point at Kibithu, and its most westerly point – Sir Creek, Gujarat State – the northern section of India has an east-to-west span of just over 1,800 miles.

The world’s second-largest country in terms of population, India is also one of the world’s largest. With large areas used for agriculture, the Himalayan Mountains to the north, and the Thar Desert making up the north-west of the county, India has a rather varied landscape.

  • 9)     India – 1,822 miles (2,932 km)


8)     Mexico – 1,958 miles (3,151 km)

Image Source: Wikimedia Commons

Measuring from the north-eastern tip of the Yucatán Peninsula, across to the north-western reaches of the Baja California state, the country measures almost 2,000 miles across in width from its most eastern point to its most western.

With large patches of desert making up large part of its northern half, and agricultural areas that are interspersed by areas of rainforest towards the south, Mexico is a varied country in terms of its landscape. 

  • 8)     Mexico – 1,958 miles (3,151 km)


7)     Australia – 2,511 miles (4,041 km)

Image Source: Wikimedia Commons

Making up much of the continent of Oceania, Australia borders the Pacific Ocean in the west, and the southern Pacific in the east. As well as being slightly higher than 2,500 miles wide, Australia’s entire land area is almost as large as that of the contiguous United States of America.

However, unlike the USA, it has a vast desert interior that makes up a large proportion of its total land use, although there are areas of rainforest across its northern and north-eastern fringes. Some temperate zones exist across parts of southern Australia. Despite its large size, it has a population of around 25 million.

  • 7)     Australia – 2,511 miles (4,041 km)


6)     Brazil – 2,603 miles (4,189 km)

Image Source: Wikimedia Commons

The largest country on the South American continent, Brazil is also the world’s sixth widest. It has an east-to-west span of just over 2,600 miles at its most extensive, from the Peru border to the Ponta do Seixas, the easternmost point of Brazil.

Tropical rainforest occupies much of the country’s northern half, through which the world’s most voluminous river – the Amazon – runs from the Andes mountains in the west to the Atlantic Ocean in the east. The southern half is occupied mainly by agricultural land, and large cities including Sao Paulo.

  • 6)     Brazil – 2,603 miles (4,189 km)


5)     United States of America – 2,800 miles (4506 km) (contiguous area)

Image Source: Wikimedia Commons

Bordered by the Atlantic and Pacific oceans on its eastern and western sides, the United States of America is the fifth widest country – if you are referring to the contiguous 48 states. If you also add the state of Alaska to this total, the width would add up to around 5,000 miles (8,000 km) – however, Alaska is divided from the contiguous USA by another country, preventing this measurement.

A country with a vast range of different and spectacular landscapes, the USA includes large temperate regions of luscious woodland on both its eastern and north-western areas. With the Great Lakes in the north, a large area of plains stretching from the Canadian border towards the Gulf of Mexico, and desert regions across the south-west, this is a country with a huge variety of environments.

  • 5)     United States of America – 2,800 miles (4506 km) (contiguous area)


4)     Indonesia – 3,181 miles (5,119 km)

Image Source: Wikimedia Commons

A vast archipelago in south-east Asia, Indonesia spans a distance that is equivalent to around one eighth of the Earth’s circumference. Its most easterly land area borders the Indian Ocean, and is located to the south of Thailand and Burma, whereas its most westerly territory borders Papua New Guinea, on the Pacific Ocean.

The country is unusual not only because the country is made up of so many different islands, but due to the fact that some of these islands consist of countries other than Indonesia – for example, the island of Borneo is shared by Indonesia, Malaysia and Brunei.

Although a significant proportion of Indonesia consists of rainforests and mountain ranges, many large cities are also situated in this country, including the metropolis of Jakarta.

  • 4)     Indonesia – 3,181 miles (5,119 km)


3)     China – 3,250 miles (5,230 km)

Image Source: Wikimedia Commons

Spanning a wide part of southern, south-eastern and central Asia, China is the world’s third largest country, with an east-to-west span of 3,250 miles.

The world’s most populated country, China consists of many large cities across its western and southern areas, particularly focused in the Lower Yangtze and North China plains.

The north and west of the country are rather desert-like in terms of climate, whereas the south of the country is typified by large mountain ranges, including the Tibetan Plateau and the Himalayas.

  • 3)     China – 3,250 miles (5,230 km)


2)     Canada – 3,426 miles (5,513 km)

Image Source: Wikimedia Commons

Based on an east-to-west measurement spanning from the Yukon and Alaska boundary in the east, to Cape Spear (Newfoundland and Labrador territory) in the west, Canada is this list’s runner-up.

Vast coniferous forests occupy much of Canada’s land area, with much of its population focused in the south and south-east of the country.

Large prairie lands occupy the south of Canada, and the large Rocky Mountains dominate the western part. As well as a vast area of tundra, over 50,000 islands also make up the north of Canada.

  • 2)     Canada – 3,426 miles (5,513 km)


1)     Russia – 5,600 miles (9,012 km)

Image source: Wikimedia Commons

Spanning from Eastern Europe in the west, and stretching across the Northern Hemisphere to the Pacific in the east, it is no surprise that Russia tops this list, with an east-to-west distance of around 5,600 miles and passes through 11 of 24 time zones.

The world’s largest country overall, Russia contains a large diversity of different landscapes – from steppe lands in the south and south-west, to plains in the west, and vast expanses of coniferous woodland in the north, center and east.

  • The widest country in the world from east to west is Russia at 5,600 miles (9,012 km) wide.


More articles from Pedal Chile


What Is the Southernmost City in the World

Ushuaia, Argentina. Formerly the world’s southernmost city

Ushuaia, Argentina. Formerly the world’s southernmost city


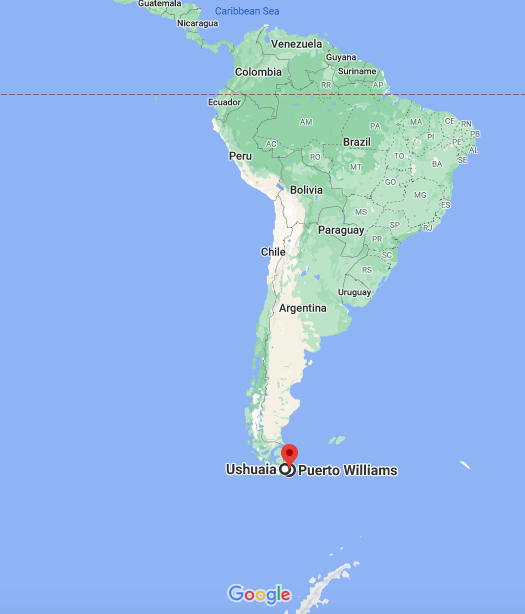
What is the southernmost city in the world?

  • Puerto Williams, Chile, is the world’s southernmost city (as of March 29th, 2019).


Puerto Williams

Puerto Williams (Image Source)

Puerto Williams (Image Source)


Town to city: Puerto Williams

On March 29th, 2019, Chile’s governmental agency, the National Institute of Statistics (INE), redefined the definition of city, changing how Puerto Williams was categorized. As a result, Puerto Williams was reclassified from a town/hamlet to a city.

  • The reclassification was done in the hopes of attracting tourists to the new “End of the Earth.”

Puerto Williams is located 6 miles (10km) further south of Ushuaia, Argentina, and is located on the other side of the Beagle Channel.

 
Image Source: (Chile)

Image Source: (Chile)


Ushuaia: Former southernmost city

The Argentine city of Ushuaia is the former title holder of the southernmost city in the world. By some definitions of a city, Ushuaia is still considered to be the true and actual southernmost city.


According to the Merriam-Webster Dictionary, a city is:


“an inhabited place of greater size, population, or importance than a town or village.”


or

According to the Cambridge Dictionary, a city is defined as:


"a large town"


Beagle Channel lighthouse in Tierra del Fuego Archipelago


Ushuaia: The 2nd Southernmost City in the World

  • Ushuaia, Argentina - 74,752 (2019) people

    • Ushuaia is also the world’s most active Antarctic gateway port, receiving over 90% of all tourists that go to Antarctica

  • Puerto Williams, Chile 2,063 (2017) people

However, as there is no actual population requirement, uniformity, or strict definition of city, once Puerto Williams was reclassified by the Chilean government, it became the true southernmost city in the world.


southernmost city of 100,000: Punta Arenas

Punta Arenas in Chile is the southernmost city in the world with over 100,000 people.

  • Population of Punta Arenas = 124,169 (2017) people

Punta Arenas is about 100 miles (160km) north of Ushuaia and Puerto Williams and is over 700 times larger than both “cities” combined in total area.


Punta Arenas vs New Zealand and southerly cities

Punta Arenas is over 500 miles (805 km) further south than Invercargill, the southernmost city in New Zealand.


about jesse.png

Jesse is Director of Pedal Chile and lives in Chile’s Patagonia. Jesse has a Master of Science in Health & Human Performance and a Bachelor of Science in Kinesiology. Hobbies: MTBing, snowboarding, reading, taster of craft beers, researcher, & cartographer.


More articles by Pedal Chile

Sources & Feferences for “southernmost city in the world:”

  1. Chile, Ministerio de Obras Públicas. “Inauguración Caleta de Pescadores de Puerto Williams.” Flickr, 4 Nov. 2017, www.flickr.com/photos/ministeriodeobraspublicas/25766796408/in/photostream/.

  2. “INE Oficializa a Puerto Williams Como ‘Ciudad’ Y Se Convierte En La ‘Ciudad Más Austral Del Mundo.’” Gobernación Provincial de Antártica, www.gobernacionantartica.gov.cl/noticias/ine-oficializa-a-puerto-williams-como-ciudad-y-se-convierte-en-la-ciudad-mas-austral-del-mundo/.

  3. La Nación. “Una Localidad Chilena Le Roba a Ushuaia La Etiqueta de Ciudad Más Austral.” Www.lanacion.com.ar, 29 May 2019, www.lanacion.com.ar/el-mundo/una-localidad-chilena-le-roba-ushuaia-etiqueta-nid2252719. Accessed 2 Feb. 2021.

  4. Staff, Reuters. “Puerto Williams, Chile Now World’s Southernmost City, Not Ushuaia, Argentina.” Reuters, 30 May 2019, www.reuters.com/article/us-chile-patagonia/puerto-williams-chile-now-worlds-southernmost-city-not-ushuaia-argentina-idUSKCN1SZ2BD.

  5. “Ushuaia.” Wikipedia, 31 Dec. 2020, en.wikipedia.org/wiki/Ushuaia.

  6. “T13 | Tele 13.” Www.t13.Cl, 16 Feb. 2019, www.t13.cl/noticia/nacional/el-motivo-puerto-williams-se-convertira-ciudad-mas-austral-del-mundo.

  7. Wikipedia. “Puerto Williams.” Wikipedia, 31 Jan. 2021, es.wikipedia.org/wiki/Puerto_Williams.

Cross Threading

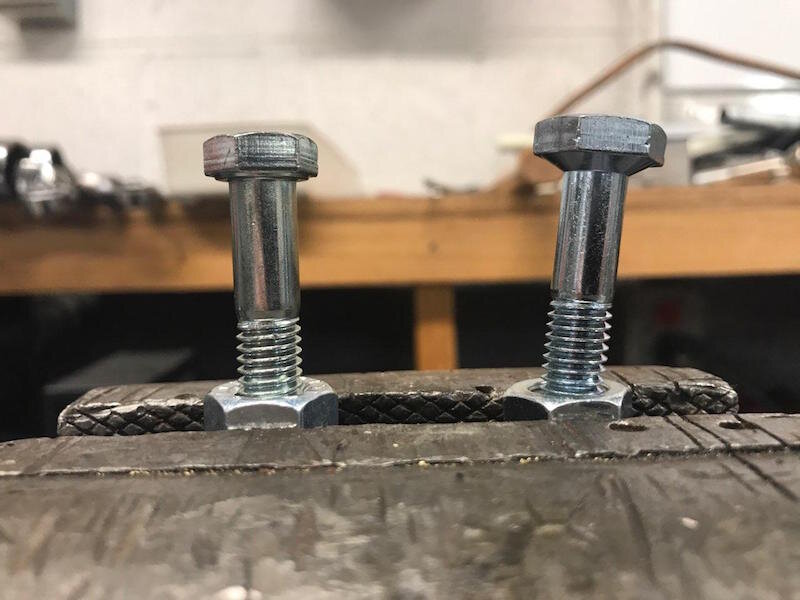
stripped or threaded.jpeg

What is cross-threading?

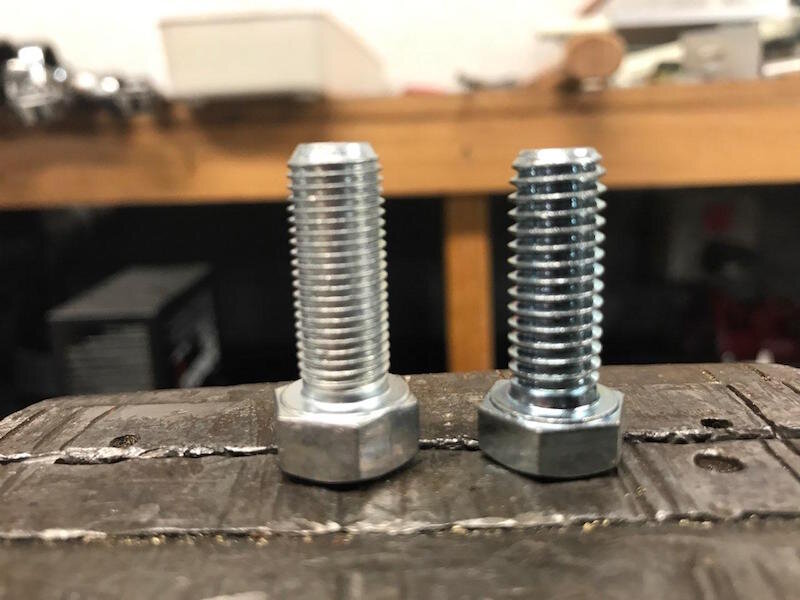
  • Cross-threading occurs when the first external thread crosses the internal thread in such a way that the thread contacted on one side of the internal thread is not on the same revolution as the thread contacted on the opposite side.


There are two types of external threaded fasteners

  • Screws - intended for use with a pre-formed internal thread or to form its own thread (self-tapping screws)

  • Bolts - intended for use with a nut or threaded hole to create a clamping force

Screws and bolts have external threads that are mated together with the internal threads of nuts and tapped holes.

2 types of cross-threading: Parallel or Angular

Crossing-threading is a very common failure when working with any threaded fasteners. Cross-threading occurs when the threaded fastener (bolt, screw) is received into a threaded nut or hole wherein the threads are not in proper alignment.

There are two main types of cross-threading:

  1. Angular cross-threading

  2. Parallel (axial) cross-threading

Angular Cross Threading

angular cross threading.jpeg

During tread mating, one common failure is called angular cross-threading, often called cross-threading for short.

Angular cross threading occurs when the bolt enters the threaded part misaligned angularly, the threads engage incorrectly and as the bolt is tightened, the threads of the bolt and/or nut fail by shearing.

  • This cross-threading is the result of the threads of the two members trying to engage with at least 1/2 pitch or revolution out of alignment. When this happens, the parts are no longer compatible and the threads wedge up upon rotation. If you continue to rotate (screw) the threads they become angularly misaligned and structurally damaged.

Parallel Cross Threading

Parallel cross threading is a more subtle form of cross threading and occurs when the thread run-up of the two parts is twisted together during initial mating. Unlike angular cross threading, parallel cross-threading can occur even without angular misalignment, as this failure is usually induced by excessive screw rotation speed during insertion.

  • This occurs when the tread patterns don’t match up perfectly.

  • Commonly happens with power tools as the threads get “over-torqued” and the threads no longer align properly

How to avoid cross threading

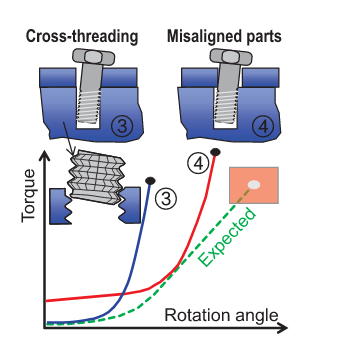
cross thread example.jpeg

The initial thread mating is the most critical time to avoiding cross threading and jamming. To avoid angular cross-threading, the external thread must not be allowed to cross under the crest of the internal thread so that the screw is aligned with the part that it is joining.


(Image Source: Jia, Zhenzhong, et al 2019)


3 simple steps to avoid cross-threading or stripping screws/bolts:

  1. Check and clean bolt/screw as needed

  2. Insert fastener and screw in opposite direction (like you’re unscrewing it) and keep turning it backwards until you hear a click sound. Once you hear this click (or feel a pop), this means that both the internal and external threads or male and female parts are in proper alignment and ready to be tightened.

  3. After hearing the click, finger tighten until it goes in smoothly, before using tools to torque to speck.

    • It’s easier to cross thread when using tools since you have more power and less accuracy

Fine vs Coarse threads & cross-threading

fine vs course threads.jpeg
  • Coarse threads are more durable and less likely to cross-thread and strip.

  • Fine threads damage easier and are easier to cross-thread. When working with fine threads, be extra careful.


about jesse.png

Jesse is the Director of Pedal Chile and lives in La Patagonia. Jesse has a Master of Science in Health and Human Performance and a Bachelor of Science in Kinesiology. Hobbies: Mountain biking, bicycle commuting, reading, snowboarding, researching, and sampling yummy craft beers.


More articles from Pedal Chile

Sources

  • Gallagher, B., Silva, M. J., & Ricci, W. M. (2014). Effect of off-axis screw insertion, insertion torque, and plate contouring on locked screw strength. Journal of orthopaedic trauma, 28(7), 427–432. https://doi.org/10.1097/BOT.0000000000000042

  • Jia, Zhenzhong, et al. “A Survey of Automated Threaded Fastening.” IEEE Transactions on Automation Science and Engineering, vol. 16, no. 1, Jan. 2019, pp. 298–310, 10.1109/tase.2018.2835382. (image source for image right of figure 2)

  • Nicolson, Edward J. and R. Fearing. “Compliant control of threaded fastener insertion.” [1993] Proceedings IEEE International Conference on Robotics and Automation (1993): 484-490 vol.1. (image source for figure 2)

  • Wikipedia. “Screw Thread.” Wikipedia, 30 Apr. 2020, en.wikipedia.org/wiki/Screw_thread.

Does Norway Have the Longest Coastline

canada vs norway.jpg

Does Norway have the longest coastline in the world??

  • The longest coastline is Canada, followed by the United States of America, Russia, Indonesia, and Chile, with Norway having the 6th longest coastline in the world.


Canada, easily has the longest coastline in the world and nearly triples the 6th longest coastline of Norway.


The longest coastlines in the world

1) Canada

canada map.jpg
  • Canada has the longest coastline in the world

    • 202,080 km or 125,567 miles


2) United State of America

United States.jpg
  • The United States of America has the second longest coastline

    • 153,646 km or 95,471 miles

    • The coastline of Alaska alone is 74,996km or 46,600 miles


3) Russia

Russia.jpg
  • Russia has the 3rd longest coastline

    • 110,310 km 68,544 miles


4) Indonesia

Jakarta.jpg
  • Indonesia has the 4th longest coastline in the world

    • 95,181 km or 59,143 miles


5) Chile

chile coast.jpg
  • Chile has the 5th longest coastline

    • 86,294 km or 53,621 miles


6) Norway

norway.jpg
  • Norway has the 6th longest coastline in the world

    • 83,281km or 51,749 miles


how are coastlines measured?

There is no objectively true coastline length measurement, since it’s impossible to precisely measure the length of any coastline. Bays, nooks, inlets, and promontories are nearly impossible to measure accurately, which is why we have a phenomenon known as the “coastline paradox.”


about jesse.png

Jesse is the Director of Pedal Chile and lives in La Patagonia. Jesse has a Master of Science in Health and Human Performance and a Bachelor of Science in Kinesiology. Hobbies: Mountain biking, bicycle commuting, reading, snowboarding, researching, and maps.


More articles from Pedal Chile

Why Does My Knee Pop When Riding a Bike

Riding with a seat way too low can lead to knee popping and injuries (Image Source: Pedal Chile)

Riding with a seat way too low can lead to knee popping and injuries (Image Source: Pedal Chile)


Ensuring that the bicycle seat (saddle), handlebars and pedals are correctly adjusted and that the bicycle is the appropriate size can be key in preventing overuse syndromes
— American Family Physician (peer-reviewed journal)

Why does my knee pop while riding a bicycle?

Riding with your saddle too low or pedaling in too high a gear, commonly results in Patellofemoral Pain Syndrome (PFPS). PFPS causes your knee to pop or click because your kneecap (patella) rubs against your femur, creating a popping sound.

  • A fairly strong indicator that you are experiencing PFPS is if you have knee pain or clicking consistently at the top of your pedal stroke.


Possible causes of knee popping or clicking while bike riding

 
  • Riding in high gears

    • Instead, increase cadence and decrease resistance (ride in easier gears)

  • Prolonged hill climbs

    • Ride hills in easier gear or modify route

  • Sub-optimal Bike Fit

    • Improper seat height

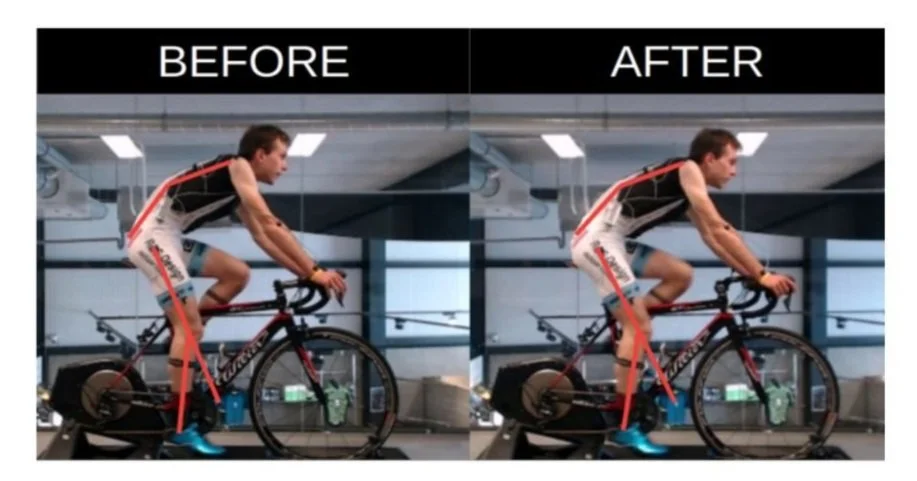
      • 25 to 30 degrees of knee flexion of the extended leg when the pedal is at 6 o’clock position (maximum height whereby the rider is not rocking back and forth across the seat when riding)

    • Too far forward on the saddle

      • Effectively lowers the height of the saddle

    • Too long of cranks

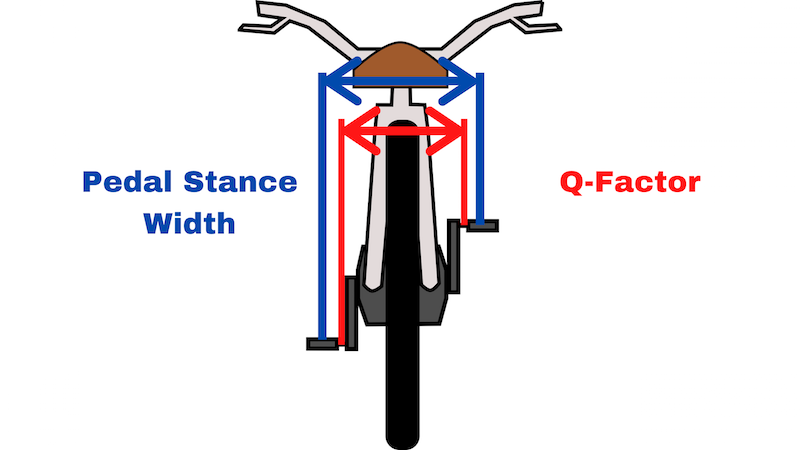
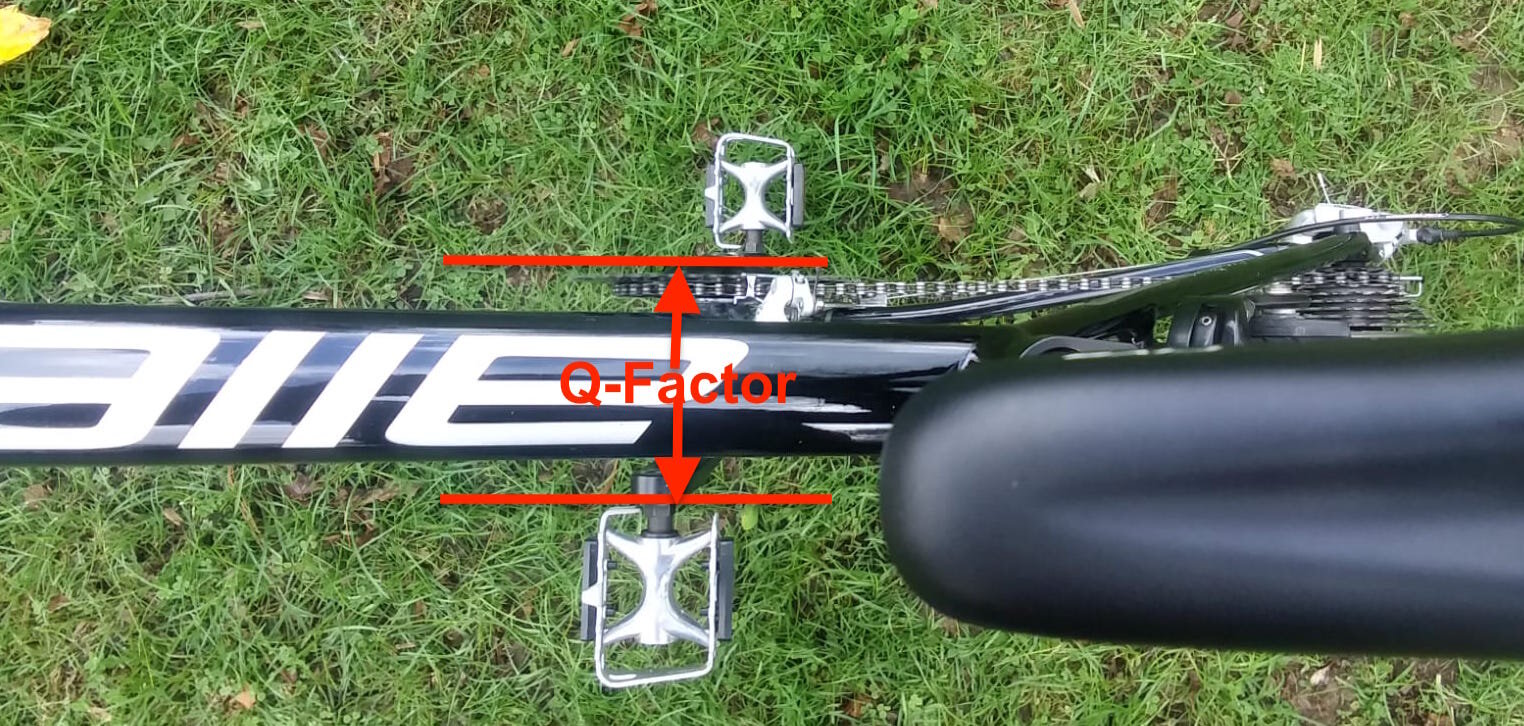
    • Incorrect Q-factor (how far your feet are apart)

  • High mileage

  • Muscular imbalances

    • Riding with a seat too low causes your quads to work significantly harder than your hamstrings, causing muscular imbalances, which are exacerbated the more and harder you ride

  • Flexibility limitations

    • Muscular imbalances lead to flexibility issues


low saddle & knee pop/clicking sound

While it’s true that cycling is low impact, bicycling is also highly repetitive. So, if your pedal stroke is not optimal, issues, pain, or injuries will manifest as many cyclists average 5,000 revolutions per hour.

How do I know if my saddle is too low?

If you can put your foot flat on the ground or close to it while stopped, your saddle is much too low.

Optimal Saddle Height: Many bicycle commuters stop at a curb so they can reach the ground safely

Optimal Saddle Height: Many bicycle commuters stop at a curb so they can reach the ground safely


causes of clicking or popping noises

There are two main reasons that your knee will click/pop:

  • Air Bubbles (caviation)

    • Occasional (infrequently) knee popping occurs when tiny air bubbles become trapped in your knee joint and burst from the action of pedaling. This is normal and nothing to worry about.

  • Pathological

    • Frequent or chronic knee popping/clicking is a cause for concern since this means your kneecap (patella) isn’t in the right position while cycling. The patella is making contact with the femur, which causes the clicking noise. There are several possible reasons, but none of them are good. Immediate BikeFitting or muscle/flexibility testing should be conducted (or visit a health care professional).

      • Osteoarthritis of the knee - Knee degeneration or wear and tear of the knee joint also causes knee noises. However, if you have osteoarthritis, there are additional symptoms, such as swelling and joint pain.

      • Frequent cycling with an improper bike setup can cause muscle imbalances, which can lead to your patella not tracking properly. The muscles around your knee start playing tug-of-war with each other, and because of the resulting imbalances, your patella (kneecap) loses out.

Also, keep in mind that It doesn’t matter what type of bike your riding; mountain, gravel, stationary, or road bike, all have the same pedal motion and knee action.

(Image Source: Fox, Wanivenhaus and Rodeo, 2012)

(Image Source: Fox, Wanivenhaus and Rodeo, 2012)


Clicking noises without pain: Cause for concern??

Yes. Frequent clicking or popping noises while pedaling, even without pain, should be cause for pause.

  • The reason for the clicking/popping noise is because your kneecap and femur are not moving properly.

  • If you continue to ride without adjusting your bike settings or address muscle imbalances (quads, calf, hamstring, & ITB), pain and injury will develop. Once you begin experiencing pain, it becomes much harder to treat.

Patellofemoral Pain Syndrome & bicycling

Patellofemoral Pain Syndrome (PFPS) is a typical cycling overuse injury with PFPS commonly known as “Biker’s Knee” and affects at least 25% of cyclists.

  • PFPS (Biker’s Knee) = Pain on the FRONT of your knee or under the kneecap.

  • Patellofemoral pain often presents as a gradual onset of knee pain behind or around the kneecap and is a common overuse injury experienced by hikers, cyclists, mountain bikers, runners, and triathletes.

The main causes of Biker’s Knee is riding with a seat that is too low and improper BikeFit or prolonged riding in high gears.


Positions on a road bicycle, (from top left) A. Seated, hands on brake hoods. B. Seated, hands in drops. C. Standing, hands on brake hoods (often used for shorter climbs). D. Standing, hands in drops (often used for sprinting) - - - (Image source &a…

Positions on a road bicycle, (from top left) A. Seated, hands on brake hoods. B. Seated, hands in drops. C. Standing, hands on brake hoods (often used for shorter climbs). D. Standing, hands in drops (often used for sprinting) - - - (Image source & quote: Kotler, Babu and Robidoux, 2016)


“Biker’s Knee” treatment

If you are experiencing frequent clicks and pops without pain, while riding, the first course of action should be adjusting your Bike Fit settings.

  • Start by adjusting seat height

However, if you also have knee pain, then it’s time to go to a PT and get some corrective exercises before you go for another ride.

  • If your seat is too low, your quad muscles will do the majority of the pedaling. This creates muscle imbalances. These muscle imbalances will alter how the tendons pull on your kneecap.

Patellofemoral Pain Syndrome self-test

A simple test to look for PFPS is to do the “step-up test.”

  1. Find a step that is 4 - 8 inches high

  2. Perform a single leg step-up

  3. Take note of where the pain is located

    • If the pain is under or around your kneecap, you may have patellofemoral pain syndrome and it’s important to seek a healthcare professional to diagnose and provide treatment. The sooner you resolve the issue the quicker you can go back to riding.

Final thought

Cycle-related injuries increase as mileage and participation increases.

Most cycling injuries are overuse or repetitive stress.

  • The first step is to avoid injuries, and that starts with an optimal fitting bicycle and a balanced training regime.

Since most bicycle-related injuries are repetitive stress, they manifest as noises and pop before they progress to pain and injury. Listen to your body, and make corrections before the pop becomes pain.


about jesse.png

Jesse is the Director of Pedal Chile and lives in Valdivia, Chile. Jesse has a Master of Science in Health & Human Performance and a Bachelor of Science in Kinesiology. Hobbies: Mountain biking, bicycle commuting, snowboarding, reading, weight-lifting, taster of craft beers, researcher, and free of any clicking or popping noises.


More articles from Pedal Chile

Sources & references for “why does my knee pop while riding a bike”

  1. Althunyan, Abdullatif K et al. “Knee problems and its associated factors among active cyclists in Eastern Province, Saudi Arabia.” Journal of family & community medicine vol. 24,1 (2017): 23-29. doi:10.4103/2230-8229.197178

  2. BAILEY, M., MAILLARDET, F. and MESSENGER, N., 2003. Kinematics of cycling in relation to anterior knee pain and patellar tendinitis. Journal of Sports Sciences, 21(8), pp.649-657.

  3. Burke, E., 2002. Serious Cycling. Champaign, IL: Human Kinetics.

  4. Fox, A., Wanivenhaus, F. and Rodeo, S., 2012. The Basic Science of the Patella: Structure, Composition, and Function. Journal of Knee Surgery, 25(02), pp.127-142.

  5. Kotler, D., Babu, A. and Robidoux, G., 2016. Prevention, Evaluation, and Rehabilitation of Cycling-Related Injury. Current Sports Medicine Reports, 15(3), pp.199-206.

  6. Oser, S., Oser, T. and Silvis, M., 2013. Evaluation and Treatment of Biking and Running Injuries. Primary Care: Clinics in Office Practice, 40(4), pp.969-986.
  7. Patel, Dilip R, and Ana Villalobos. “Evaluation and management of knee pain in young athletes: overuse injuries of the knee.Translational pediatrics vol. 6,3 (2017): 190-198. doi:10.21037/tp.2017.04.05

  8. Pruitt, Andrew L. and Fred Matheny. “Andy Pruitt's Complete Medical Guide for Cyclists.” (2006).

  9. Song, S. J., Park, C. H., Liang, H., & Kim, S. J. (2018). Noise around the Knee. Clinics in orthopedic surgery, 10(1), 1–8. https://doi.org/10.4055/cios.2018.10.1.1

  10. Thompson, M.J., & Rivara, F. (2001). Bicycle-related injuries. American family physician, 63 10, 2007-14 .

  11. Vora, Molly et al. “Patellofemoral pain syndrome in female athletes: A review of diagnoses, etiology and treatment options.” Orthopedic reviews vol. 9,4 7281. 20 Feb. 2018, doi:10.4081/or.2017.7281

  12. Zyl, E. & Schwellnus, Martin & Noakes, Timothy. (2001). A Review of the Etiology, Biomechanics, Diagnosis, and Management of Patellofemoral Pain in Cyclists. Int.SportsMed J.. 2. 1-34.

what is a rock garden in mountain biking

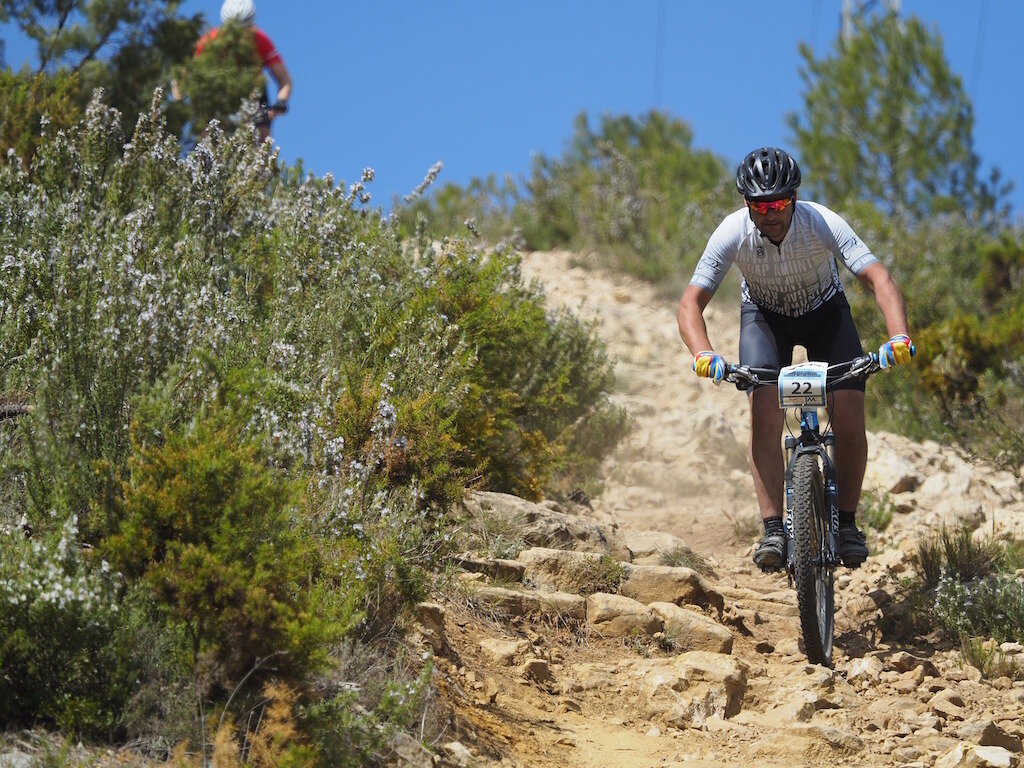
A Mountain bike racer descending a rock garden

A Mountain bike racer descending a rock garden

 
Rock Garden = All rock, no dirt
— Pedal Chile

What is a rock garden?

A rock garden is a section of trail that is covered by rocks

  • Can be downhill or uphill

  • The rocks can be of varying sizes

  • Range from a small patch of rocks to entire sections of mostly rocky terrain

  • Can be natural or man-made


about jesse.png

Jesse is the Director of Pedal Chile and lives in Valdivia, Chile. Jesse has a Master of Science in Health & Human Performance and a Bachelor of Science in Kinesiology. Hobbies: Mountain biking, bicycle commuting, snowboarding, reading, weight-lifting, rock garden lover, taster of craft beers, & researcher.


More articles from Pedal Chile

How Much Faster Is A Road Bike Than A mountain Bike

road vs mtb pic.jpg

How much faster is a road bike than a mountain bike?

A road bicycle is 10 to 30% faster than a mountain bike and is 15% faster on average at the same power output on smooth, paved surfaces.

  • Riding posture, rolling resistance, frame geometry, and weight are the main reasons for road bikes being faster with the same level of effort.


Riding position & speed

The greatest determining factor of speed over 8mph (13 kph) is riding position.

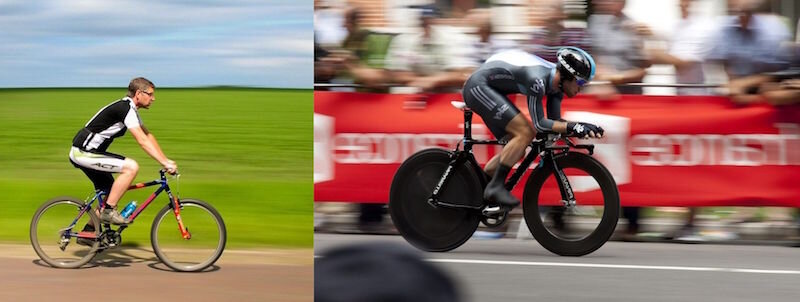
  • Cycling in an upright posture, as you would on a mountain bike, can be twice as slow as being tucked down while riding in the drops. The faster you go, the larger role aerodynamics and riding position have on your speed.

 
Mostly upright on the MTB (left) or super-streamlined on the racing bike with the aero-bars (right)

Mostly upright on the MTB (left) or super-streamlined on the racing bike with the aero-bars (right)


Rolling resistance: MTB vs Road

The interaction between the tire and terrain is known as rolling resistance. Rolling resistance is affected by:

  • Tire Width

    • Wider tires have more contact with the terrain and are slower and heavier

  • Tire Pressure

    • Less pressure increases contact with the ground and thus are harder to pedal (slower). As tire pressure increases, the tire holds its shape more firmly, which reduces tire deflection

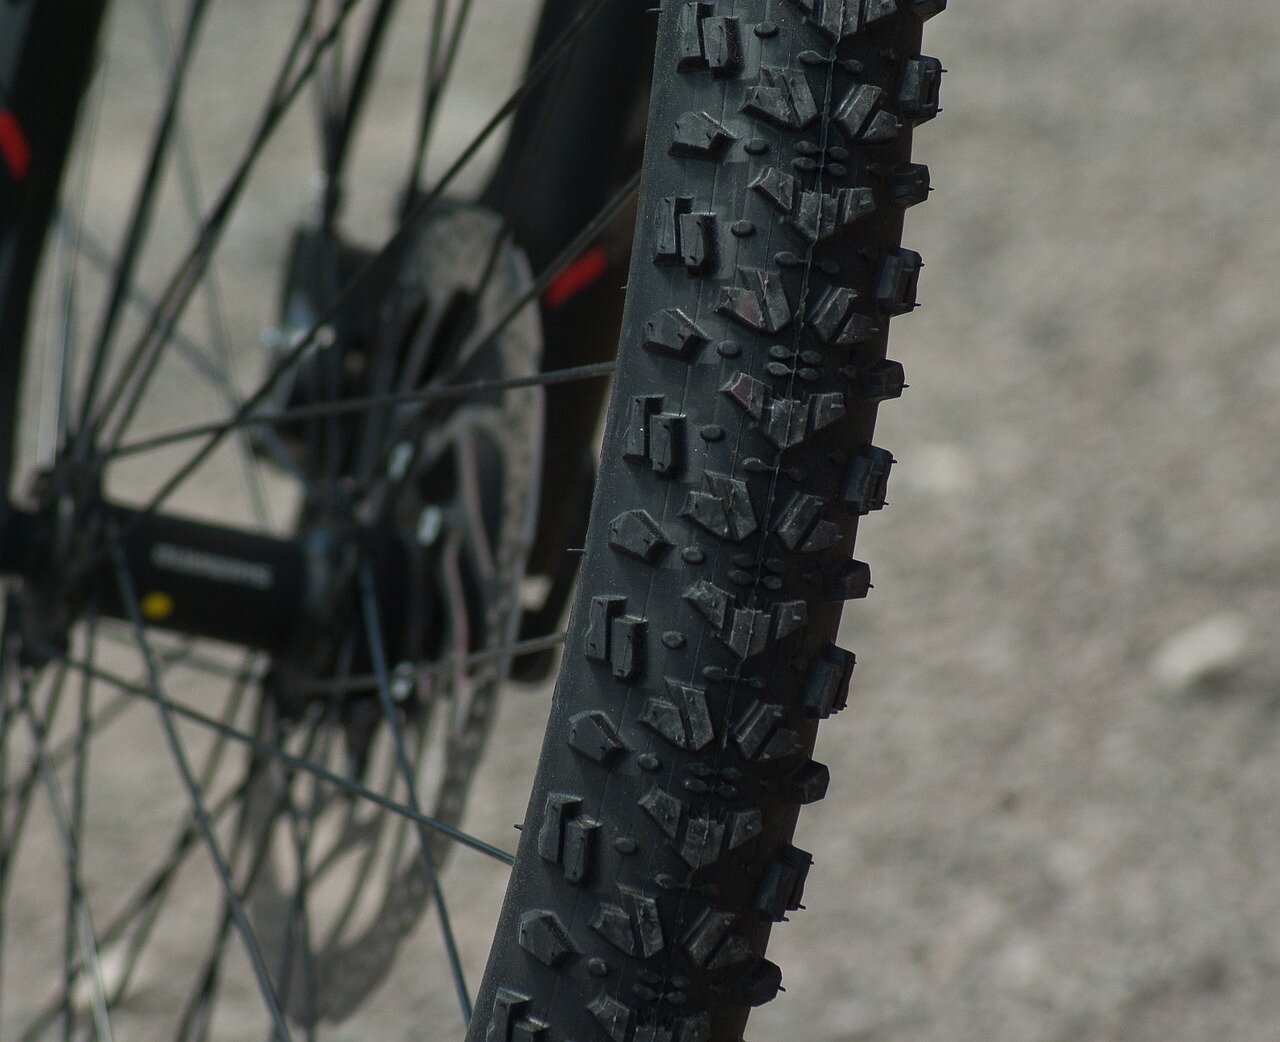
  • Tread Type

    • Larger tread is slower

  • Wheel Diameter

    • Smaller diameter tires at the same pressure are easier to deform, making them slower

All of these make larger, knobbier, low-PSI, and heavier mountain bike tires slower than the sleek and narrow road bicycle tires.


Weight difference between bikes: Road Vs MTB

For every 12 pounds gained or lost there is a 1-mph difference in speed. A full-suspension mountain bike will usually weigh at least 12 more pounds than a road bike.

  • Full-Suspension MTB = ~ 30 lbs

  • Road Bicycle = ~ 17 lbs

Just from the weight factor alone, a road bicycle will be at least 1 mph faster compared to the heavier mountain bike.


Frame geometry differences: Road & MTB

Road and mountain bikes have vastly different frame geometries, which affect both aerodynamics and pedal efficiency.

  • Road bikes place you in a more optimal position for pedaling while trail bikes focus on rider stability for descending technical singletrack.

  • Mountain bikes are engineered to be sturdy while maximizing clearance and control. Road bikes are designed to maximize aerodynamics and pedaling economy

Gearing

chain.png

Most mountain bikes, especially trail bikes, are geared for climbing and riding off-road, which is why they lack big gears. Road bikes are designed with a broader range of gear combinations. Once you reach high speeds on smooth surfaces, the difference in gearing becomes obvious.


about jesse.png

Jesse is Director of Pedal Chile and lives in Valdivia, Chile. Jesse has a Master of Science in Health & Human Performance and a Bachelor of Science in Kinesiology. Hobbies: MTBing, snowboarding, reading, taster of craft beers, and researcher.


Sources

  • Chowdhury, Harun & Alam, Firoz & Khan, Iftekhar. (2011). An experimental study of bicycle aerodynamics. International Journal of Mechanical and Materials Engineering. 6. 269-274.

  • Glaskin, Max. Cycling Science: How Rider and Machine Work Together. Ivy Press, 2019.

  • Petersen, Grant. Just Ride: a Radically Practical Guide to Riding Your Bike: Equipment, Health, Safety, Attitude. Workman Pub., 2012.

Difference Between Dirt Jumper and Hardtail

Dirt jumper mtb and rider

Dirt jumper mtb and rider


What is the difference between a Dirt Jump and Hardtail Mountain Bike?

A Dirt Jumper is a type of hardtail mountain bike. It’s a slightly bigger version of a BMX bike with a front shock. Compared to the more popular trail-riding hardtail MTB, the dirt jumper has only 1-gear, no front brake, slack frame geometry, low seat-post, and is relatively heavy.

A dirt jumper is also known as an urban or street mountain bike. These bikes are designed for aerial stunts and landing jumps. They don’t have a rear shock because the rear suspension absorbs energy making jumping and pumping on pump tracks less efficient.

dirt jumper vs bmx.jpg

HardTail = front suspension only, thus hardtail, since the rear shock is absent.


Dirt jumper vs trail riding hardtail

dirtjumpter vs hardtail.jpg

A dirt jumper is a cross between a BMX trick bike and a traditional mountain bike. When picturing a Dirt Jump MTB, think of a BMX bike with a front fork and slightly bigger wheels.

Dirt Jumper vs trail mtb

Trail riding a dirt jumper


Can I trail ride on a dirt jumper bicycle?


You can, but you wouldn’t want to.

Dirt Jumpers are heavy, have 1-gear, are inefficient for pedaling in both frame design and seat height, and don’t have a front brake.

They are specifically engineered for landing tricks and jumps. Even if you upgraded components, the frame geometry is similar to a Downhill MTB, with its slack angles for stability. The 26-inch tires are over 10% less efficient, compared to 29ers when climbing, nor do they deflect trail obstacles or roll over hazards as efficiently.


slopestyle vs dirt jumper bike

A slopestyle mountain bike is a full-suspension dirt jumper. These bikes are used for bigger terrain and jumps, which is why they have a rear shock.


Looking for help reaching your goals??  Performance Coach Jesse can help

Looking for help reaching your goals?? Performance Coach Jesse can help


about jesse.png

Jesse is Director of Pedal Chile and lives in Valdivia, Chile. Jesse has a Master of Science in Health & Human Performance and a Bachelor of Science in Kinesiology. Hobbies: MTBing, snowboarding, reading, taster of craft beers, researcher, & compression sock wearer.


Bike Chain Lubricant Alternatives


olive oil and bicycle.jpeg

Are there substitutes for bicycle chain lubes?

Technically, you can use any lubricant for your bicycle chain, however, some lubes work significantly better than others.

Also, keep in mind that most lubricants are designed to be used in a closed system, not for use in a bicycle drivetrain that’s exposed to all the environmental elements and dirt & debris.


This article analyzes many common lubes you have in your home and lets you know if they are suitable for application on your bike chain. First, we start with what makes an ideal bike-specific lubricant.


What is an ideal bicycle lubricant?

A bicycle lube provides a lubricant film that separates metal-to-metal contact between the cogs and the chain. The main method for reducing drivetrain friction is by creating a single layer of lubricant molecules which impedes the direct contact of surfaces.

An ideal bicycle lubricant will be thick enough to prevent any metal-to-metal contact but still thin enough to penetrate the inner components of the chain. If the chain lube is too thick (high viscosity), the performance decreases as the drag force is increased, which not only makes you slower but also increases the rate that your chain will stretch or wear.

Ingredients in a bike-specific chain lubricant:

All lubricants are composed of two components:

  1. A base oil (mineral, synthetic, or biological)

  2. Plus additives


Lubes are 80-98% base oil and 2-20% additives


Ideal additives for bicycle chains:

  • Anti-wear - These additives, such as Lubrizol LZ4370LG, significantly reduces wear in your drivetrain system. These function by creating a protective layer that reduces the amount of contact and thus reduces wear.

  • Friction Modifiers - These are additives that modify how the frictional behavior of the system works by forming a chemical layer on the top layer that has a very low shear strength. Molybdenum dialkyldithiocarbamate is a very common example used for bicycle-specific chain lubes.

  • Oxidation Stability (anti-oxidants) - Oxidation is increased from exposure to water and heat. These are especially important for biological or eco-friendly lubricants (veggie oil base lube).


Grease is the same as lube except that grease has thickeners added to it, which is why it’s described as “a sponge that holds the lubricant.”


Chain lube alternatives

Vegetable Oils

Olive oil. For you salad or your chain???

Olive oil. For you salad or your chain???


  • Vegetable oils, such as canola, sesame seed, corn, peanut, cottonseed, linseed, rapeseed, and olive oil, all reduce the amount of friction to very similar levels to those of bike-specific lubricants.

    • Castor oil is a very poor performance bike-lubricant because it is so thick, it’s not able to penetrate the rollers.

While most vegetable oils will reduce the amount of force needed to pedal a bicycle to similar levels of those of bike specific lubricants (in laboratory settings), the main reason you wouldn’t want to use them is because they will pick up LOTS of DIRT and GRIME.

Also, keep in mind that veggie oils have low oxidative stability compared to synthetic or petroleum-based oils, which means the oils will degrade and lose their lubricating and protection properties fairly quickly.

  • Exposure to water makes veggie oils oxidize or breakdown even faster and turn into a sludge (not good for base oils in wet bike-lubes).

  • Vegetable oils offer poor protection against corrosion

Can I use veggie oils as a chain lube?

No. These oils will attract dirt and the oil itself will degrade and oxidize quickly. These types of oils should be avoided unless used in an emergency.

Chainsaw (bar) Oil

Chainsaw oil is designed to be sticky. This oil needs to stick to a chain that is spinning at between 10,000 to 14,000 RPM. Compare this to a bicycle chain that is spinning at 60 - 100 RPM. You can see quite easily how much stickier chainsaw oil needs to be than what is optimal for your bike chain.

Main functions of chainsaw (bar) oil:

  • Stick to the blade

  • Reduce operating temperatures as the blades get very hot

  • Protect against rust

99% of chainsaw oil is either absorbed into the sawdust, sticks to the logs, gets trapped in the loggers’ clothes, or ends up on the ground.

Bar (chainsaw) oil is designed to be super sticky since nearly all of it flings off the blade. This super sticky component means it won’t come off your bike chain but means that any dirt or debris will instantly stick to it too.

chainsaw.png

Can I use chainsaw oil on my bike chain?

Yes. You can use chainsaw (bar) oil as a wet bike chain lube and would be best used for riding in inclement weather where you need a sticky oil that will not get washed off from rain or wet conditions. Unless you’re consistently riding in rainy weather, this lube is too sticky for most riding conditions.

motor oils

motor oil.jpg

Motor oils have a much greater percentage of additives compared to bike-specific lubes. Also, the additives of motor oil are much different than those for chain oils, as motor oil has extreme pressure (EP) additives, deactivators, and tackiness agents, none of which make your bicycle chain perform any better.

  • Engine oils are more susceptible to oxidation than any other lubricant (keep in mind these oils are designed for a closed system)

Can I use motor oil as a chain lube?

You can use motor oil. However, it’s not recommended as this oil is too thick and won’t penetrate the inner components.

If you want to make a ‘thin’ version of this it would be better, but motor oil is not an ideal chain lubricant as the additives don’t protect against wear nor does it provide optimal reduction of friction. Also, it oxidizes when applied in open-air applications as it’s designed to be used in a closed system.

Gear oil

Gear oil is a thick lubricant made specifically for transmissions, transfer cases, and automobile differentials. Most gear oils have extreme pressure (EP) additives, which are useless for bicycle lubes, as cyclists rarely even generate 1-horse-power. The high viscosity attracts dirt and debris making this less than an ideal lube.

  • High viscosity = very thick. Gear oil is too thick to penetrate the rollers and internal workings of your chain.

  • Extreme Pressure (EP) additives are a vital component of gear oil. The additive profile of these gear oils does nothing for cycling.

  • Viscosity Improver - These oils are designed to be used in machines that run at high temperatures. As the temperature changes, it alters the viscosity of the lubricant, so additives are important when used in machinery. Also, the lubricant is responsible for removing heat from the system. None of these functions are needed for bicycle lubes and these modify the frictional force and wear properties of lube, neither of which is good for optimal bicycle chain performance.


Can I use gear oil on my bike chain?

Use at your own risk of sub-optimal performance and a very dirty chain as trail and road debris will cling to this sticky oil designed specifically for specialized high-temperature gearboxes.

Machine Oil

Light machine oil, such as sewing machine oil, is nearly 100% pure-base oil or white mineral oil.


Sewing machine oil (Image Source: Wikimedia Commons)

Sewing machine oil (Image Source: Wikimedia Commons)


Can I use machine oil on my chain?

Since machine oils are nearly 100% white mineral oil, these lack performance, and anti-wear additives. If you don’t care about performance this will work, but I’d reserve this oil for the sewing machine.

wd-40

WD40 should NOT be used on your chain since WD40 is NOT a lubricant. WD40 is a solvent. This means you can use it to clean your chain, however, after application, you will need to apply an actual lubricant.


wd40 shop.jpeg

READ: I have an entire article about WD-40, you can read if you would like more info.


3-IN-1 Multi-Purpose Oil

oil alternatives.jpeg

3-IN-1 oil uses a naphthenic base oil, which is known for its high freezing point, little oxidation, ideal viscosity for chain use, and great viscosity variation with temperature fluctuations.

  • Naphthenic based oils are relatively aggressive for seals, which is why they are not used in closed systems. However, they are great for bicycle chains, which is why several bike-specific lube manufacturers use them as a base oil.


READ: I’ve also written a more in-depth article about 3-IN-ONE Oil for bicycle chains if you would like a more in-depth reading.


Can I use 3-IN-ONE oil on my chain?

Yes. 3-IN-ONE oil was originally designed for bicycle chains and outperforms many bike-specific lubricants available in the market place.


Final Thought

You can use any oils or lubricants that are not very thick and penetrates every link of your chain. However, a superior bike lubricant will provide you with over 30 watts of power compared to many of the lubes mentioned. So how much faster is 30 watts of power….about 1 mph (1.6kph).

All the alternative lubricants mentioned on this list are wet lubes. Depending on the trail or road that your riding, the lubes ability to propel dirt is probably the most important characteristic. Weather permitting, a quality dry lubricant is best for the prevention of grime accumulation.


World's FASTEST BIKE LUBE

 
derek cycling fact.png


about jesse.png

Jesse is the Director of Pedal Chile and lives in Valdivia, Chile. Jesse has a Master of Science in Health & Human Performance and a Bachelor of Science in Kinesiology. Hobbies: Mountain biking, bicycle commuting, snowboarding, reading, weight-lifting, taster of craft beers, & researching.


More articles from Pedal Chile

Why Do Baseball Players Wear Arm Sleeves

baseball and compression sleeve.jpg

We’ve all seen baseball players wearing those skin-tight compression sleeves on their arms when they play, and for the uninitiated, you might wonder why do they wear them?

They have become immensely popular over the past decade and are now considered a crucial component for many players – something they’ll never play without.  While they are most commonly seen worn by pitchers and catchers, you wouldn’t be surprised to see other players sporting them as well, often in the color of their team kit. 

They are a great example of how modern sports science has evolved and how players are taking cutting-edge research and applying it to their gear in order to optimize their performance.


With this in mind, let’s look at why baseball players wear compression arm sleeves:

  1. Injury Prevention

  2. Improved Performance

  3. Faster Recovery


Preventing Injury


In simple terms, these compression sleeves compress the muscles in the player’s arm and helps to maintain good blood circulation. 

Faster Blowflow = More Oxygen For Your Muscles

When worn correctly, they can speed up blood flow to the heart and significantly improve the oxygenation in the blood

This support is welcomed by those arm muscles and it gives the arm more robustness against strain and injury.  The increased oxygen and blood flow defer muscle fatigue for longer meaning that there are fewer opportunities for injury to creeping in.  In fact, some studies have even shown that beyond the blood and oxygen benefits, compression sleeves can also assist with the removal of waste fluids from elbow tissue – helping to avoid some of the more debilitating elbow injuries that are all too common in the sport. 

They really seem to have a myriad of benefits in keeping players sharp and injury-free game after game.


Positive Side Effect: Avoid Turf Burn

Beyond that internal benefit, there’s also the very practical benefit of avoiding turf burn when you’re sliding into base or diving for a catch.  We’ve all had those moments where we leap across the turf only to get up and realize that we’ve left a couple of layers of skin on the ground where we dived.  These sleeves help to protect that skin and avoid some of the nastiness – allowing players to throw themselves across the ground with reckless abandon.


Improving Your Game


The increased circulation above also has the effect of improving performance.  With the increased oxygen levels in the blood thanks to the compression, the arm has a more fluid range of motion and this directly impacts how well that arm performs when playing.  With more motion and more fluidity, you’re able to accomplish much more precision and power than you would without a sleeve. 

Delayed Fatigue

This becomes even more important towards the end of games when your body starts to fatigue.  This is when you need an extra boost to make those clutch plays and compression sleeves help you do that.


Warm Muscles = Happy Muscles

The second way it improves your performance is by regulating temperatures.  On cold days, the sleeve can be instrumental in keeping your pitching and/or catching arm warm so as to maintain its flexibility and overall performance.  By keeping things tightly wound up, you give yourself the best chance of staving off the cold air and keeping your arm in peak condition. 

This is especially useful when you’ve been out of the action for a while and all of a sudden need to make a key play to turn the game around.  In those moments, you need your arm to be warm and ready to perform.   

Trust us, your future self will thank you.


Recover Better


Lastly, the compression sleeve can even be useful after the game is over.  In a similar way that athletes will use compression tights to help their bodies recover after intense exertion, the sleeve can also help with post-game recovery by working on the blood circulation through the arm. 

Reduce Inflammation

They can reduce any inflammation and swelling that might have shown up because of the repeated throwing and hitting motions inherent in the sport. 

By increasing the blood flow – they assist in how efficiently and how quickly you can recover from a game or a training session.  For players who are consistently pushing themselves to the brink, the importance of recovery is something that should not be underestimated – and compression sleeves can be very helpful in that regard.

Reduced Muscle Soreness

Over a long season, many players will start to feel the adverse effects of their efforts.  Muscle soreness, little injury niggles, sustained swelling – all of this can throw a spanner into late-season games if you aren’t taking care of yourself. 

Compression sleeves not only help the immediate recovery but improve robustness over a long season.  They provide those compounding benefits that might be negligible at first, but a couple of months in really start to pay off.  That’s why if you get into the habit of using compression technology – you can really squeeze out the very last dregs of performance from your body – allowing you to play at your best for longer.

bottom line


So, there you have it!  The humble compression sleeve turns out to be much more useful than what meets the eye.  It’s not just to look cool.  It’s a very effective piece of performance gear that can bring the best out of you and ensure that you play through the whole season ahead, injury-free.


If you’re looking to get your hands on one, make sure to get the right fit.  It needs to be tight enough to compress your muscles, but without interfering with your natural movement.  Try a couple and find what feels right for you.  It’s also a bonus to get one with breathable material so that the sweat is just wicked away.


We’re big fans of baseball compression sleeves, and we think you’ll be too.

Cost of Bike Fitting

bikefitting image.png

How much does a BikeFitting cost?

Basic/Beginner Bike-Fitting

A basic or beginner BikeFitting averages around $100 and takes about an hour.


A Basic Bike Fitting Includes:

  • Saddle position

    • Fore/aft

    • Height

  • Handlebar position

    • Reach

    • Height


This service is usually for beginners and is very basic.

Saddle position along with handlebar position is set. Depending on the shop, cleat positioning may or may not be part of this service, which for anyone riding with clipless pedals, is one of the most important BikeFit settings.

This level of BikeFitting is often included for free from your local bike shop after purchasing a bicycle. However, the level of skill and expertise that you will receive will vary dramatically, depending on the qualifications from the specific shop.

Advanced bike-fit

bikefitting shoes.png

The Advanced or Complete BikeFitting is more in-depth than the Basic/Beginner Bike Fitting and takes about 1.5 - 2 hours for $100 to $200+ USD.

This fitting is also static, but more comprehensive tools are used, such as Saddle Pressure Mappers and Goniometers.


Advanced Static Bike Fitting Includes:

 
  • Seat Position

    • Angle

    • Height

    • Fore/Aft

  • Saddle width and type

  • Cleat Positioning on the pedals (foot/pedal interface)

  • Cockpit Adjustments

    • Handlebar height & reach

    • Brake lever & shifter position (hand/wrist comfort)

  • Flexibility testing and injury history to access optimal positioning

  • Riding style, ability, and bike characteristics

 
(Image Source: Christiaans and Bremner, 1998)

(Image Source: Christiaans and Bremner, 1998)

3d motion bike fit / Dynamic

(Image Source: Braeckevelt 2018)

(Image Source: Braeckevelt 2018)

A Dynamic Bike-Fit using 3D motion software provides the same bicycle settings as listed above in the Advanced BikeFit, but these settings have been determined via either video or motion software while the cyclist is riding.

This is the most costly of the fittings since the 3D software, equipment, and expertise is expensive and limited.

Depending on your location, this service starts at around $250 - $300 and can go up to over $700, depending on what additional bikefitting/aero services you seek.

3D motion vs static fitting

Since 3D motion software is high-tech and expensive then it must be better than a static bikefitting???

Well not so much.

Both methods, static or dynamic, will put you into your optimal Bike Fit Range and both have their pros and cons. Understanding the interaction between you and your bike is most important since your optimal fit changes over time and sometimes even during one ride.


Do your own bike-fit at home and save hundreds of dollars :)


about jesse.png

Jesse is Director of Pedal Chile and lives in Valdivia, Chile. Jesse has a Master of Science in Health & Human Performance and a Bachelor of Science in Kinesiology. Hobbies: MTBing, snowboarding, reading, taster of craft beers, researcher, & compression sock wearer.


More articles from Pedal Chile

References

  • Braeckevelt, Jarich. “Data Driven Bike Fitting.” Science and Engineering Conference on Sports Innovation, Proceedings, 2018, pp. 47–49.

  • Christiaans, H. and Bremner, A., 1998. Comfort on bicycles and the validity of a commercial bicycle fitting system. Applied Ergonomics, 29(3), pp.201-211.

  • Silberman M., Webner D., Collina S., Shiple B. (2005) Road bicycle fit. Clinical Journal of Sports Medicine 15(4): 271-276. (fig 1 and 2).

  • Wadsworth DJS, Weinrauch P. THE ROLE of a BIKE FIT in CYCLISTS with HIP PAIN. A CLINICAL COMMENTARY. Int J Sports Phys Ther. 2019;14(3):468-486

Will Lighter Wheels Make You Faster When Cycling

Dr. Jeremy Grooves and the two bicycles used in his study, with the steel frame bike on the left and the carbon frame bike on the right. (Image Source: Grooves 2010)

Dr. Jeremy Grooves and the two bicycles used in his study, with the steel frame bike on the left and the carbon frame bike on the right. (Image Source: Grooves 2010)


Light weight wheels accelerate faster than heavy ones, which helps when you’re taking off from a stop, but heavy wheels maintain more of their momentum than light wheels, which helps you keep your speed on rolling roads and trails.
— Grant Petersen - Just Ride: A Radically Practical Guide to Riding Your Bike


A popular cycling expression is:


"A pound off the wheels is worth two off the frame”


However, is this expression true; will lighter wheels make you faster?

 
  • Lighter wheels speed up quicker so you can accelerate faster than heavier wheels

    • Lighter wheels also de-accelerate faster so they don’t hold their momentum as well over rolling terrain or trail obstacles

  • Heavier wheels spin for longer

    • Wheels store kinetic energy so heavier wheels will take longer to speed up but they hold their momentum longer, which takes them longer to slow down


Total bicycle weight + rider weight, including gear (water, keys, phone, spare tube, etc) is significantly more important than wheel rotational weight since wheels store kinetic energy with heavier wheels spinning for a longer duration.

The only time energy is lost during bicycling is during braking. While lighter wheels accelerate quicker they also slow down faster.


Bicycle wheels & power losses


Wheels account for nearly 10% of the total power required to propel your bike forward.


Wheel performance is effected by 3 main factors (on flat ground):

  1. Wheel drag = 8% of total power loss

    • Wheel drag is the dominant factor in wheel performance and is responsible for nearly 10% of total aerodynamic drag

  2. Wheel mass = 1% of power loss

    • Wheel mass or what some would call wheel weight is almost 10 times less significant than wheel aerodynamics

  3. Wheel inertia = .5% of power loss

    • Rotating weight is nearly 100 times less significant than wheel drag

What this means is that a heavier wheel that is more aerodynamic will be significantly faster overall than a lighter wheel that has more wheel drag.


Rotating wheel weight = no difference

Rotating wheel weight makes nearly no difference at all. Why is this so?

Energy Losses Only Come From Braking

Rotating weight only comes into play during accelerations or de-accelerations. Lighter wheels speed up quicker, but they also slow down faster compared to heavier wheels, which speeds up slower but carries speed longer.


Lighter wheels & climbing

Riding at a constant speed there is no change in the inertia. While it’s easier to climb the lighter your bike is, it makes no difference where the weight savings comes from - - - you, your bike, gear, or your wheels.


Bicycle weight & commuting study


It’s not about the bike”
— Lance Armstrong


In 2010, Dr.Jeremy Groves conducted a self-experiment where he commuted 27 miles (43.5km) round-trip to work on either his carbon frame bicycle or his old steel framed bike:

  • Steel frame bicycle total weight = 29.75lbs (13.5 kg)

  • Carbon frame bike total weight = 20.9 lbs (9.5kg)

  • Total vertical = 2766 feet (843 m)

  • Flat pedals for both bicycles

In addition to the steel bicycle weighing almost 9 lbs (4kg) more, the rim plus tire weight was over one-pound (453grams) heavier, per each total wheel.

So what bike was faster?

The steel-framed bicycle was slightly faster than the carbon fiber bike that was nearly 9 pounds lighter including over 2 pounds lighter in total wheel weight.

Front rims from Dr. Jeremy Grooves

Front rims from Dr. Jeremy Grooves

  • Steel framed bicycle

    • 30 rides

    • 809 miles (1302 km)

    • Top speed = 36 mph (58 kph)

      • Same top speed for both

    • Fastest ride = 1 hour 37 minutes and 40 seconds

    • Slowest ride = 1 hour 57 minutes and 44 seconds

    • Average time = 1 hour 47 minutes and 48 seconds

    • Average speed = 15.02 mph

  • Carbon framed bicycled

    • 26 rides

    • 711 miles (1144 km)

    • Top speed = 36 mph (58 kph)

      • Same top speed for both

    • Fastest ride = 1 hour 40 minutes and 50 seconds

    • Slowest ride = 2 hours 3 minutes and 20 seconds

    • Average time = 1 hour 48 minutes and 21 seconds

    • Average speed = 14.95 mph

Average Speed: Carbon frame vs Steel frame

Source: Groves, J. (2010). Bicycle weight and commuting time: randomised trial. BMJ, 341(dec09 2), pp.c6801–c6801.

While this is just one example from one study, these results are typical of what has been known since the 1970s. For every 12 pounds gained or lost, there is a 1 mile per hour difference in speed (1.6kph), regardless of where the weight comes from.

In this particular study, Dr. Grooves was more comfortable on his steel framed bicycle. For recreational riding or bicycling commuting, comfort and bikefit are more important than weight, especially wheel weight.


Total bicycle weight & performance

Total bicycle weight, along with total rider weight, is the most dominant factor as opposed to where the weight actually comes from.

  • Heavier bikes are slower uphills but faster down them

  • Lighter wheels speed up quicker but also slow down quicker

  • Lighter wheels are less durable. Fixing a flat tire is 1,000% slower than even the slowest bicycle


Final thought

Carbon rims look faster, and for some, that is everything. However, unless you are constantly accelerating then braking, lighter wheels won’t make you faster.

The only time that energy is lost is from braking, so the extra energy that it takes to propel heavier wheels will be stored. This stored energy allows the wheels to spin longer, which is great for riding rolling hills or terrain with trail obstacles.


about jesse.png

Jesse is the Director of Pedal Chile and lives in La Patagonia. Jesse has a Master of Science in Health and Human Performance and a Bachelor of Science in Kinesiology. Hobbies: Mountain biking, bicycle commuting, reading, snowboarding, researching, and sampling yummy craft beers.


Sources for “Will Lighter Wheels Make You Faster?”

  1. Anhalt, Tom. “Why Wheel Aerodynamics Can Outweigh Wheel Weight and Inertia.” Slowtwitch.com, 31 May 2011, www.slowtwitch.com/Tech/Why_Wheel_Aerodynamics_Can_Outweigh_Wheel_Weight_and_Inertia_2106.html.

  2. Armstrong, L. (2000) It’s Not About the Bike: My Journey Back to Life. London: Yellow Jersey.

  3. GCN Tech. “Why Rotating Weight Doesn’t Matter On Your Road Bike | GCN Tech Debunk A Common Cycling Myth.” YouTube, 12 July 2020, www.youtube.com/watch?v=0QDnUkUaQfk.

  4. Glaskin, Max. Cycling Science: How Rider and Machine Work Together. Illustrated, University of Chicago Press, 2012.

  5. Glaskin, Max. Cycling Science: How Rider and Machine Work Together. Illustrated, University of Chicago Press, 2018.

  6. Groves, J. (2010). Bicycle weight and commuting time: randomised trial. BMJ, 341(dec09 2), pp.c6801–c6801.

  7. Willett, Kraig. “| ‘An Ounce off the Wheels Is Worth a Pound off the Frame’: Is Rotational Weight Crucial?” CapoVelo.com, 12 Mar. 2020, capovelo.com/ounce-off-wheels-worth-pound-off-frame-rotational-weight-crucial/.

What Is The Capital City of Patagonia

northern and southern patagonia.jpg

Image Source: (Wilson et al.)


Patagonia is an imaginary region, whose actual geography consists of Argentine Eastern Patagonia and Chilean Western Patagonia.”
— From the book Patagonia by James Button
 
political divisions of patagonia.jpeg


What is the capital city of Patagonia?

  • Patagonia has no capital city because it’s a geographic space/area in name only and is not a nation, country, or political entity.

world map with patagonia.png

Patagonia is a geographic region consisting of Argentine Eastern Patagonia and Chilean Western Patagonia, which together form the geographic space/area known as Patagonia.

Patagonia starts at 39° southern latitude and ends at Cape Horn, and takes up the entire area of the southerly reaches of the Southern Cone on the continent of South America.

Western Patagonia: Chilean Patagonia


Image Source: (Rodríguez Torrent et al.)

Image Source: (Rodríguez Torrent et al.)


Eastern Patagonia: Argentinean Patagonia

Image source: (Parolin et al.)

Image source: (Parolin et al.)


about jesse.png

Jesse is Director of Pedal Chile and lives in Chile’s Patagonia (most of the year). Jesse has a Master of Science in Health and Human Performance and is an avid mountain biker. Hobbies: Reading, writing, MTBing, researching, and snowboarding.


References

  1. Button, James. Patagonia. Editorial Patagonia Media, 1 June 2020.

  2. Parolin, María Laura, et al. “Genetic Admixture Patterns in Argentinian Patagonia.” PLOS ONE, vol. 14, no. 6, 17 June 2019, p. e0214830, 10.1371/journal.pone.0214830.

  3. Rodríguez Torrent, Juan Carlos, et al. “FRONTERAS INTERNAS Y HEGEMONÍAS PREDICATIVAS EN CHILE: EL CASO DE LA PATAGONIA AUSTRAL.” Chungará (Arica), no. ahead, 2018, pp. 0–0, 10.4067/s0717-73562018005001501.

  4. Wilson, Ryan, et al. “Glacial Lakes of the Central and Patagonian Andes.” Global and Planetary Change, vol. 162, Mar. 2018, pp. 275–291.

3-in 1 Oil For Bike Chain

3inone oil.jpg

Bicycle chain lubrication reduces the wear of your drivetrain components and lowers the amount of force needed to pedal the bike. Because of this, chain lubrication is important for both elite cyclists and recreational riders as quality lubricants allow your chain to spin faster and protects against wear. 

3-IN-ONE Oil was developed in 1894 and was originally formulated for use on bicycles. However, many components on bikes have changed drastically in the 125+ years since George W. Cole created his now-famous multi-purpose oil.


Can we use 3-IN-1 oil on our bicycle chains?

In laboratory experiments, 3-IN-ONE Oil outperforms nearly half of the bicycle-specific (all-season) lubricants for speed tests. 3-IN-1 has a generic petroleum base that is stable and won’t degrade from temperature fluctuations or aging.

  • When applied properly (sparingly), 3-IN-ONE is no more susceptible to ‘gumming-up’ than standard all-season bicycle-specific lubricants. (Over-lubing is responsible for collecting dirt and turning into a grimy paste).

3-in-ONE OIL: Base ingredient

Every lubricant is a mixture of base oils and additives.

Early forms of lubricants were nothing more than pure base oils, and as technology advanced, tribologists engineered additives to enhance lubrication characteristics, depending on the application.

Base Ingredient in 3-IN-ONE Multi-Purpose Oil

triflow.jpeg
  • Petroleum Oil base

    • According to the Material Data Safety Sheet for 3-IN-ONE oil, it’s over 97% Hydrotreated Heavy Naphthenic Oil, which means it’s refined from petroleum crude oil.

      • For comparison, Heavy Naphthenic Petroleum Oil is also one of the main ingredients in certain Tri-Flow lubricant products.


Base oils come from 3 sources:


  • Biological

    • Either from a vegetable or animal

  • Mineral

    • Petroleum-based

      • Such as 3-IN-ONE multi-purpose oil

  • Synthetic

    • Artificially created but usually modified petroleum components

3-IN-ONE oil is not a vegetable or synthetic oil but is instead a mineral oil as it has a petroleum-base and is not artificially created.


From a 1915 edition of Popular Mechanics

From a 1915 edition of Popular Mechanics


Performance: 3-IN-ONE vs bike-specific lubes

In studies that test power loss and lubricants, 3-IN-1 oil performs better than about 40% of bike-specific lubes.

  • The difference between the best and worst-performing lube is 10 watts

    • This translates to 1/3 mph or .5kph. Over a distance of 25 miles (40km) this 10-watt difference equates to 45 seconds.

3-IN-ONE oil performs ~6 watts better than the worst performing bike-specific lubricant.

  • There are over a dozen of these poorly performing bicycle-lubricants. It’s not uncommon for manufacturers to spend more money on marketing as opposed to R & D or cutting agents.


3-IN-ONE & Protection Against Wear

Performance, or ability to reduce the coefficient of friction is just one measure though, as good lubes not only make pedaling more efficient, they protect against wear.

Once again, 3-IN-1 performs better than about 45% of the other bike lubes

  • Often-times there is an inverse relationship between performance and wear. 3-IN-1 is close to the middle in both of these factors, which makes sense, as the brand was developed to balance performance and protection (their motto after all is - lubes, penetrates rust, & cleans).

However, measuring wear in a laboratory has its challenges to real-world application as only “fatigue wear” can be measured.

In the book Cycling Science: How Rider and Machine Work Together, Max Glaskin, the author, says:


"One lube as good as another? In the lab and with a brand new chain, it’s been shown that lubricants are not significantly different from one another when it comes to reducing the friction of a chain."


Max is correct in the sense that the difference between high-performance lubes is minuscule, but untrue when your talking about the difference between the best and worst lubes since 10 watts is very significant. Also, as Max Glaskin notes in his book, “real life is dirtier and harsher than in a laboratory.”


Final thought

bicycle lubes and 3in1.jpeg

There are certainly better lubricants available, but you can actually do much worse than 3-in-1.

Keeping your chain clean and properly lubed is essential for longevity and performance. A clean and properly maintained chain that’s lubed with 3-IN-ONE oil will outperform a dirty chain that is incorrectly lubricated, even with a superior lubricant.

While it might not be fashionable to use 3-IN-ONE oil, its a fraction of the price and outperforms many wet lubes that you will find at your local bike shop. If you choose poorly when selecting a lube, you might find yourself being passed by a “newbie.”


about jesse.png

Jesse is Director of Pedal Chile and lives in Valdivia, Chile (most of the year). Jesse has a Master of Science in Health & Human Performance and is an avid MTBer, snowboarder, & reader of narrative non-fiction, and bicycle commuter.


What is Q-Factor on a Bike

Q-Factor or Q-Faktor in German (Image Source: Knetsch and Holtkamp)

Q-Factor or Q-Faktor in German (Image Source: Knetsch and Holtkamp)


Q-Factor. Yes, Q-Factor.
It’s the distance between the pedals at the outside of the cranks. In other words, it’s how far apart the cranks put your feet. Are you walking a tightrope, or giving birth? Pedaling a bicycle or walking like a duck?
— Grant Petersen - Bicycle designer and creator of the term "Q-Factor" from his website

 
q-factor.png

What is Q-Factor on a bicycle?

Q-Factor or crank width is the distance between the two pedal cranks and is a measure of stance width, which is similar to your walking step-width.

  • QF Range
    • 135mm on an aerodynamic Road Bicycle to 235mm for a Fat Tire Bike.

Grant petersen & Quack Factor

Grant Petersen, the founder of Rivendell Bicycle Works, bike author, and originator of the term Q-Factor says in his book, Just Ride: A Radically Practical Guide to Riding Your Bike:


"Q-Factor is the term I made up in 1990 to describe the distance between the outside of the left crank's pedal hole and the outside of the right crank's pedal hole."


and


"Crank makers talk about Q-Factor, but few know that the Q stands for "quack." Ducks waddle with their feet far apart relative to their leg length, and thus have high Q-Factors."


q-factor-mtb.png
 

Q-Factor & Frame Clearance

Q-Factor is set by the crankarms, and is generally limited by bottom bracket width and tire clearance. Because of this, Q-Factor will differ between bicycling disciplines rather than between cyclists of different sizes.

Q-Factor size is largely determined by the frame clearance:

  • Rear tire-width clearance

    • Larger tires need more clearance and thus have larger Q-Factor (Fat Tire vs Road Bicycle tires)

  • Number of chainrings on your crankset

    • Mountain Bikes with multiple chainrings have larger Q-Factor (1X vs 3X drivetrain)

      • Single-speed bikes have lower QF compared to geared bicycles due to several factors including narrower chainstays

For example, larger tires require wider chainstays, which then further requires more hub space, then a wider bottom bracket, all of which increase the Q-Factor or distance between the pedals.


The image below, from Otso Cycles, shows the difference between bike components and their effect on Q-Factor.

 
Comparison of road bike and fat tire bike on QF (Image Source: Otso Cycles)

Comparison of road bike and fat tire bike on QF (Image Source: Otso Cycles)


Image Source Journal of Sport and Health Science (2020)

Image Source Journal of Sport and Health Science (2020)


Q-Angle, Q-Factor & Pedal Stance Width

  • Q-Factor, Q-Angle, and Pedal-Stance Width are NOT the same.

These 3 bicycle terms are not synonyms and should not be used interchangeably:

  • Q-Factor = horizontal width between pedals

  • Q-Angle (Quadriceps Angle) = measure of alignment between the femur and tibia

    • (Q—Factor does affect Q-Angle)

  • Pedal-Stance-Width = distance between the midpoint of the two feet


qfactor.jpeg


Q-Factor & Performance

Bicycles designers try to keep the Q-Factors as narrow as possible, regardless of bike type. Smaller Q-Factors are better for aerodynamics, handling, and are more natural for pedaling.

 
Awesome! Tell me more:)


Optimal Q-Factor & Walking

Q-Factor (QF) in cycling is similar to step-width in walking. The average walking step-width is between 70 to 120 mm and increases to 130 to 170 mm while climbing stairs. Even bicycles with very narrow QF are wider than the average walking step.

Since walking is human nature, it makes sense that bicycle engineers create bikes that put cyclists in their most natural position, which for Q-Factor means more narrow than wide as this more closely mimics our walking pattern or gait


“A comparison between the stance phase of the gait cycle and the downstroke of the pedal cycle” (Image &amp; Quote Source: Disley 2014)

A comparison between the stance phase of the gait cycle and the downstroke of the pedal cycle” (Image & Quote Source: Disley 2014)


Best QF for Bicycling

Before Q-Factor became a term, this same dimension was called “tread” over 100 years prior. However, not much scientific research has been conducted to determine the ideal Q-Factor, since the majority of studies focus their attention on seat height and aerodynamics.

What the available research says:

  • Narrow is better (up to a point as too narrow is possible)

    • Muscles work less the further the pedals are moved out (also up to a point….think about squatting at the gym)

    • Narrow QF improves riding efficiency (better power generation and more aerodynamic)

  • Hip-width to pedal-width (QF) is probably not that important

  • Every rider has a unique QF

    • Do you suffer from knee pain while cycling and have tried everything else?? A closer examination of your Q-Factor might be prudent


If your feet are positioned too narrow or too wide you may experience pain on the side of your knees or in your feet and will be more pronounced for those who ride clipless pedal systems.

Final Thought

The difference in performance between 90mm and 180mm is 5-watts. As Q-factor gets wider, especially for mountain bikes, your pedal efficiency suffers in order to increase downhill performance.


about jesse.png

Jesse is the Director of Pedal Chile and lives in La Patagonia. Jesse has a Master of Science in Health and Human Performance and a Bachelor of Science in Kinesiology. Hobbies: Mountain biking, bicycle commuting, reading, snowboarding, researching, and sampling yummy craft beers.


Sources & references for “What is Q Factor On A Bike?”

  1. Burt, Phil. Bike Fit : Optimise Your Bike Position for High Performance and Injury Avoidance. London, Bloomsbury, 2014.

  2. Disley, B. X. (2014). Q Factor in cycling: kinematic and physiological effects [Doctoral dissertation, University of Birmingham]

  3. Disley, Benedict Xavier, and Francois-Xavier Li. “Metabolic and Kinematic Effects of Self-Selected Q Factor during Bike Fit.” Research in Sports Medicine, vol. 22, no. 1, 2 Jan. 2014, pp. 12–22, 10.1080/15438627.2013.852093.

  4. FitzGibbon, Sinead et al. “INTERVENTION AT THE FOOT-SHOE-PEDAL INTERFACE IN COMPETITIVE CYCLISTS.” International journal of sports physical therapy vol. 11,4 (2016): 637-50.

  5. Jensen, RL, Watts, PB. Energy economy: effect of lateral pedal width variations relative to Q-angle in avid cyclists. In Proceedings of the XXVI Congress of the International Society of Biomechanics in Sports (Kwon, Y-H, Shim, J, Shim, JK, and Shin, I-S, editors) 2008;316-319

  6. Knetsch, Tobias, and Max Holtkamp. “ATSB1805 Bike-Fitting I (Leistungssteigerung) [Institut Für Sportwissenschaft].” Wiki.ifs-Tud.de, 18 June 2018, wiki.ifs-tud.de/biomechanik/aktuelle_themen/projekte_ss18/atsb1805.

  7. Otso Cycles. “Q-Factor and the Voytek.” Otso Cycles, otsocycles.com/pages/q-factor-and-the-voytek.

  8. Petersen, Grant, and Retsu Takahashi. Just Ride: A Radically Practical Guide to Riding Your Bike. New York, Workman Pub, 2012.

  9. Thorsen, Tanner Austin, "EFFECTS OF INCREASED Q-FACTOR ON KNEE BIOMECHANICS DURING CYCLING. " Master's Thesis, University of Tennessee, 2018.

  10. Thorsen, Tanner, et al. “Increased Q-Factor Increases Frontal-Plane Knee Joint Loading in Stationary Cycling.” Journal of Sport and Health Science, vol. 9, no. 3, May 2020, pp. 258–264.